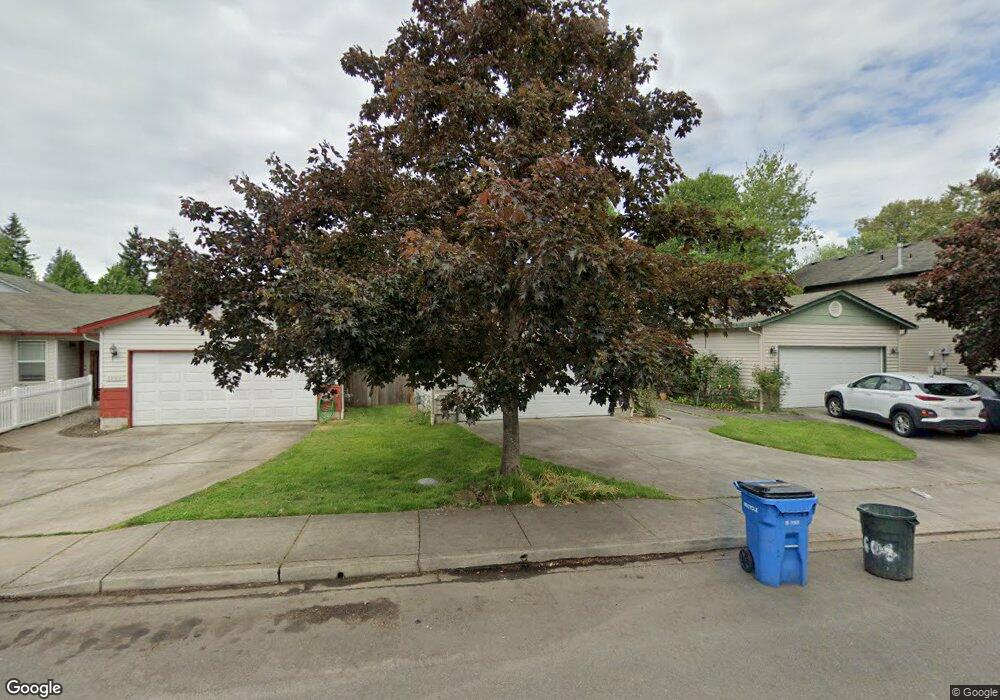
1604 SW 6th St Battle Ground, WA 98604
Estimated Value: $323,000 - $414,653
3
Beds
2
Baths
1,020
Sq Ft
$352/Sq Ft
Est. Value
About This Home
This home is located at 1604 SW 6th St, Battle Ground, WA 98604 and is currently estimated at $358,663, approximately $351 per square foot. 1604 SW 6th St is a home located in Clark County with nearby schools including Maple Grove Primary School, Battle Ground High School, and Firm Foundation Christian School.
Ownership History
Date
Name
Owned For
Owner Type
Purchase Details
Closed on
Aug 22, 2005
Sold by
Vik Keith A and Vik Patricia L
Bought by
Vik Properties Llc
Current Estimated Value
Purchase Details
Closed on
Dec 3, 2004
Sold by
Schmitke Grant D and Schmitke Heather
Bought by
Vik Keith A and Vik Patricia L
Home Financials for this Owner
Home Financials are based on the most recent Mortgage that was taken out on this home.
Original Mortgage
$104,000
Interest Rate
5.64%
Mortgage Type
New Conventional
Purchase Details
Closed on
Sep 6, 2000
Sold by
Anderson Construction Llc
Bought by
Schmitke Grant D
Home Financials for this Owner
Home Financials are based on the most recent Mortgage that was taken out on this home.
Original Mortgage
$99,600
Interest Rate
8.13%
Create a Home Valuation Report for This Property
The Home Valuation Report is an in-depth analysis detailing your home's value as well as a comparison with similar homes in the area
Home Values in the Area
Average Home Value in this Area
Purchase History
| Date | Buyer | Sale Price | Title Company |
|---|---|---|---|
| Vik Properties Llc | -- | -- | |
| Vik Keith A | $130,000 | Chicago Title Insurance | |
| Schmitke Grant D | $110,689 | Chicago Title Insurance Co |
Source: Public Records
Mortgage History
| Date | Status | Borrower | Loan Amount |
|---|---|---|---|
| Previous Owner | Vik Keith A | $104,000 | |
| Previous Owner | Schmitke Grant D | $99,600 |
Source: Public Records
Tax History Compared to Growth
Tax History
| Year | Tax Paid | Tax Assessment Tax Assessment Total Assessment is a certain percentage of the fair market value that is determined by local assessors to be the total taxable value of land and additions on the property. | Land | Improvement |
|---|---|---|---|---|
| 2025 | $2,092 | $261,582 | $125,000 | $136,582 |
| 2024 | $1,698 | $256,708 | $125,000 | $131,708 |
| 2023 | $2,118 | $236,815 | $125,000 | $111,815 |
| 2022 | $2,123 | $269,639 | $125,550 | $144,089 |
| 2021 | $1,880 | $234,958 | $118,125 | $116,833 |
| 2020 | $1,670 | $190,921 | $63,250 | $127,671 |
| 2019 | $1,445 | $192,282 | $64,900 | $127,382 |
| 2018 | $1,564 | $194,771 | $0 | $0 |
| 2017 | $1,389 | $154,800 | $0 | $0 |
| 2016 | $1,361 | $149,772 | $0 | $0 |
| 2015 | $1,355 | $134,638 | $0 | $0 |
| 2014 | -- | $127,172 | $0 | $0 |
| 2013 | -- | $115,878 | $0 | $0 |
Source: Public Records
Map
Nearby Homes
- 1513 SW 6th St
- 1512 SW 5th St
- 502 SW 15th Ave
- 1816 SW 6th St
- 1711 SW 3rd St
- 2111 SW 5th St
- 0 W Main St Unit 793373106
- 0 W Main St Unit 261126278
- 2301 SW 5th Cir
- 2307 SW 5th Cir
- 0 NW 2nd St Unit 2 & 3 780233409
- 0 NW 2nd St Unit 3 282019710
- 0 NW 2nd St Unit 2 167106682
- 893 31st St
- 805 32nd St
- 637 31st St
- 838 32nd St
- 1807 NW 3rd St
- 1600 NW 3rd St
- 1608 NW 3rd St