Estimated Value: $524,898 - $653,000
4
Beds
4
Baths
2,245
Sq Ft
$265/Sq Ft
Est. Value
About This Home
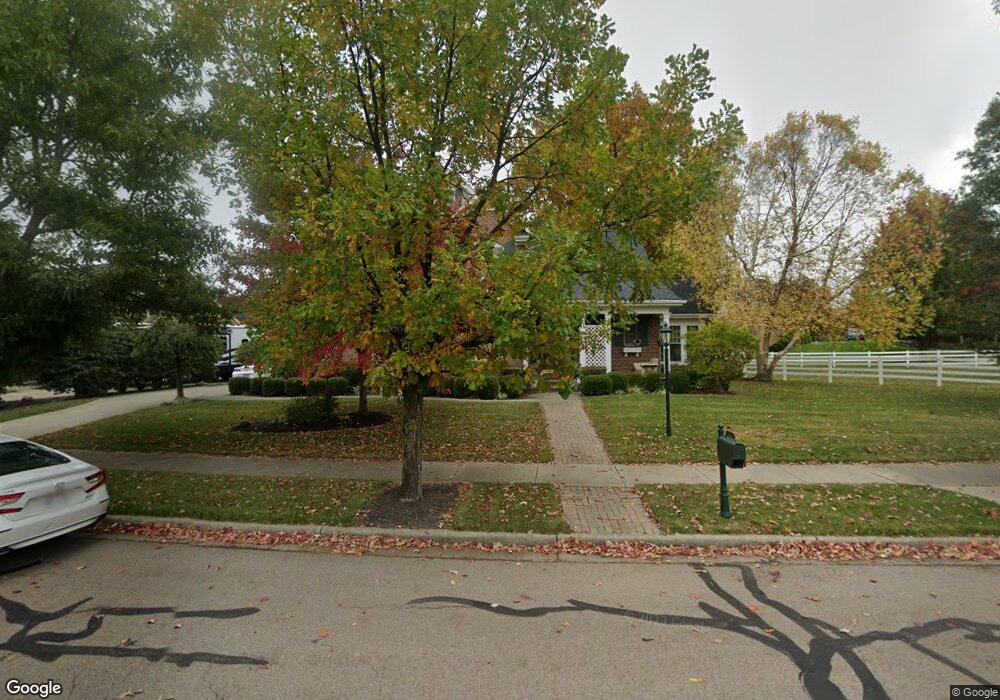
This home is located at 1604 Turfland Blvd S, Xenia, OH 45385 and is currently estimated at $594,475, approximately $264 per square foot. 1604 Turfland Blvd S is a home located in Greene County with nearby schools including Trebein Elementary School, Jacob Coy Middle School, and Beavercreek High School.
Ownership History
Date
Name
Owned For
Owner Type
Purchase Details
Closed on
May 3, 2013
Sold by
Cochran Jeffery K and Cochran Chai N
Bought by
Roberts Clay A
Current Estimated Value
Home Financials for this Owner
Home Financials are based on the most recent Mortgage that was taken out on this home.
Original Mortgage
$364,900
Outstanding Balance
$258,152
Interest Rate
3.52%
Mortgage Type
VA
Estimated Equity
$336,323
Purchase Details
Closed on
Jun 12, 2007
Sold by
Newhouse Carolyn F and Newhouse James O
Bought by
Cochran Jeffery K and Cochran Chai N
Home Financials for this Owner
Home Financials are based on the most recent Mortgage that was taken out on this home.
Original Mortgage
$310,400
Interest Rate
6.42%
Mortgage Type
Unknown
Purchase Details
Closed on
Jul 30, 2003
Sold by
Stonehill Development Ltd
Bought by
Newhouse Carolyn F and Newhouse James O
Home Financials for this Owner
Home Financials are based on the most recent Mortgage that was taken out on this home.
Original Mortgage
$286,840
Interest Rate
5.47%
Mortgage Type
Construction
Create a Home Valuation Report for This Property
The Home Valuation Report is an in-depth analysis detailing your home's value as well as a comparison with similar homes in the area
Home Values in the Area
Average Home Value in this Area
Purchase History
| Date | Buyer | Sale Price | Title Company |
|---|---|---|---|
| Roberts Clay A | $364,900 | Midwest Title Company | |
| Cochran Jeffery K | $388,000 | Attorney | |
| Newhouse Carolyn F | $46,000 | Hallmark Title |
Source: Public Records
Mortgage History
| Date | Status | Borrower | Loan Amount |
|---|---|---|---|
| Open | Roberts Clay A | $364,900 | |
| Previous Owner | Cochran Jeffery K | $310,400 | |
| Previous Owner | Newhouse Carolyn F | $286,840 |
Source: Public Records
Tax History Compared to Growth
Tax History
| Year | Tax Paid | Tax Assessment Tax Assessment Total Assessment is a certain percentage of the fair market value that is determined by local assessors to be the total taxable value of land and additions on the property. | Land | Improvement |
|---|---|---|---|---|
| 2024 | $9,211 | $163,770 | $26,390 | $137,380 |
| 2023 | $9,211 | $163,770 | $26,390 | $137,380 |
| 2022 | $8,610 | $134,190 | $20,300 | $113,890 |
| 2021 | $8,696 | $134,190 | $20,300 | $113,890 |
| 2020 | $8,738 | $134,190 | $20,300 | $113,890 |
| 2019 | $8,939 | $126,050 | $19,210 | $106,840 |
| 2018 | $7,791 | $126,050 | $19,210 | $106,840 |
| 2017 | $7,731 | $126,050 | $19,210 | $106,840 |
| 2016 | $7,623 | $121,710 | $19,210 | $102,500 |
| 2015 | $7,671 | $121,710 | $19,210 | $102,500 |
| 2014 | $7,492 | $121,710 | $19,210 | $102,500 |
Source: Public Records
Map
Nearby Homes
- 1247 Homestead Dr
- 1382 Prestonwood Ct S
- 1121 Westover Rd
- 1589 Stonebury Ct
- Torino II Plan at The Courtyards at Stonehill Village
- Palazzo Plan at The Courtyards at Stonehill Village
- Promenade III Plan at The Courtyards at Stonehill Village
- Portico Plan at The Courtyards at Stonehill Village
- Verona Plan at The Courtyards at Stonehill Village
- 1462 Champions Way
- 1427 Triple Crown Way
- 1238 Freedom Point
- 2073 Lincolnshire Dr
- 1678 Fairground Rd
- 1535 Stretch Dr
- 2162 Sulky Trail
- 1416 Hilltop Rd
- 2331 Eastwind Dr
- 895 Alpha Rd
- 1481 Stone Ridge Ct
- 1608 Turfland Blvd S
- 1574 Scottsgate Ct N
- 1580 Scottsgate Ct N
- 1612 Turfland Blvd S
- 1605 Turfland Blvd S
- 1609 Turfland Blvd S
- 1570 Scottsgate Ct N
- 1611 Turfland Blvd S
- 1323 Homestead Dr
- 1616 Turfland Blvd S
- 1318 Homestead Dr
- 1304 Homestead Dr
- 1311 Scottsgate Ct S
- 1619 Fairtrail W
- 1577 Scottsgate Ct N
- 1311 Homestead Dr
- 1235 Homestead Dr
- 1567 Scottsgate Ct N
- 1566 Scottsgate Ct N
- 1231 Homestead Dr