16045 Spring Valley Rd Morrison, IL 61270
Estimated Value: $227,000
About This Home
This home is located at 16045 Spring Valley Rd, Morrison, IL 61270 and is currently priced at $227,000, approximately $156 per square foot. 16045 Spring Valley Rd is a home located in Whiteside County with nearby schools including Northside School, Southside School, and Morrison Junior High School.
Ownership History
We collect this data history from publicly available records. To have your information removed, we recommend requesting removal directly through your county’s website.
Purchase Details
Purchase Details
Purchase Details
Purchase History
We collect this data history from publicly available records. To have your information removed, we recommend requesting removal directly through your county’s website.
| Date | Buyer | Sale Price | Title Company |
|---|---|---|---|
| -- | None Listed On Document | ||
| -- | None Available | ||
| $155,000 | -- |
Tax History
We collect this data history from publicly available records. To have your information removed, we recommend requesting removal directly through your county’s website.
| Year | Tax Paid | Tax Assessment Tax Assessment Total Assessment is a certain percentage of the fair market value that is determined by local assessors to be the total taxable value of land and additions on the property. | Land | Improvement |
|---|---|---|---|---|
| 2025 | $3,000 | $51,357 | $4,176 | $47,181 |
| 2024 | $2,739 | $47,249 | $3,713 | $43,536 |
| 2023 | $2,666 | $45,385 | $2,915 | $42,470 |
| 2022 | $2,523 | $43,038 | $2,595 | $40,443 |
| 2021 | $2,257 | $41,231 | $2,317 | $38,914 |
| 2020 | $2,266 | $39,617 | $2,065 | $37,552 |
| 2019 | $2,284 | $39,920 | $1,886 | $38,034 |
| 2018 | $2,358 | $38,888 | $1,603 | $37,285 |
| 2017 | $2,478 | $40,843 | $1,629 | $39,214 |
| 2016 | $2,806 | $39,677 | $1,511 | $38,166 |
| 2015 | $30 | $41,046 | $2,084 | $38,962 |
| 2014 | $2,901 | $39,752 | $2,030 | $37,722 |
| 2013 | $30 | $41,046 | $2,084 | $38,962 |
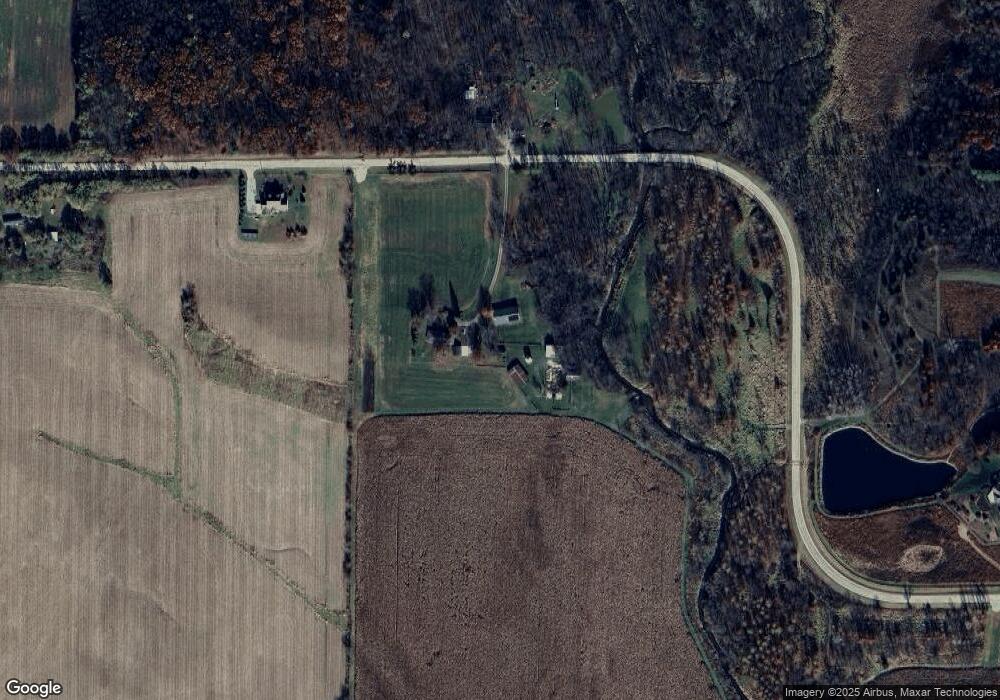
Map
- 0 Spring Valley Rd Unit 26078455
- 18250 Malvern Rd
- 15648 Norrish Rd
- 15344 Norrish Rd
- 000 Sawyer & Wayne Rd
- 18175 Folker Rd
- TBD Hilltop Dr
- 18760 Hillside Rd
- 802 Glenwood Dr
- 523 Barden St
- 2999 Hartman Rd
- 511 E High St Unit 5
- 300 Prospect St
- 00 N Jackson St
- 208 Johnson St
- 13629 Garden Plain Rd
- 14801yorktown Rd
- 411 E North St
- 407 N Genesee St
- 402 W Lincolnway
- 16076 Spring Valley Rd
- 15961 Spring Valley Rd
- 21491 Lake Rd
- 16473 Spring Valley Rd
- 15561 Spring Valley Rd
- 15609 Penrose Rd
- 16866 Spring Valley Rd
- 0 Spring Valley Rd Unit 192018
- 17798 Spring Valley Rd
- 0 Spring Valley Rd Unit MRDQC4109590
- 0 Spring Valley Rd Unit MRD12550280
- 0 Spring Valley Rd Unit 24279635
- 0 Spring Valley Rd Unit MRD11863190
- 0 Spring Valley Rd Unit MRD07346612
- 0 Spring Valley Rd Unit 129543
- 0 Spring Valley Rd Unit 10589997
- 0 Spring Valley Rd Unit QC4109590
- 21291 Lyndon Rd
- 21272 Lyndon Rd
- 21242 Lyndon Rd
Ask me questions while you tour the home.