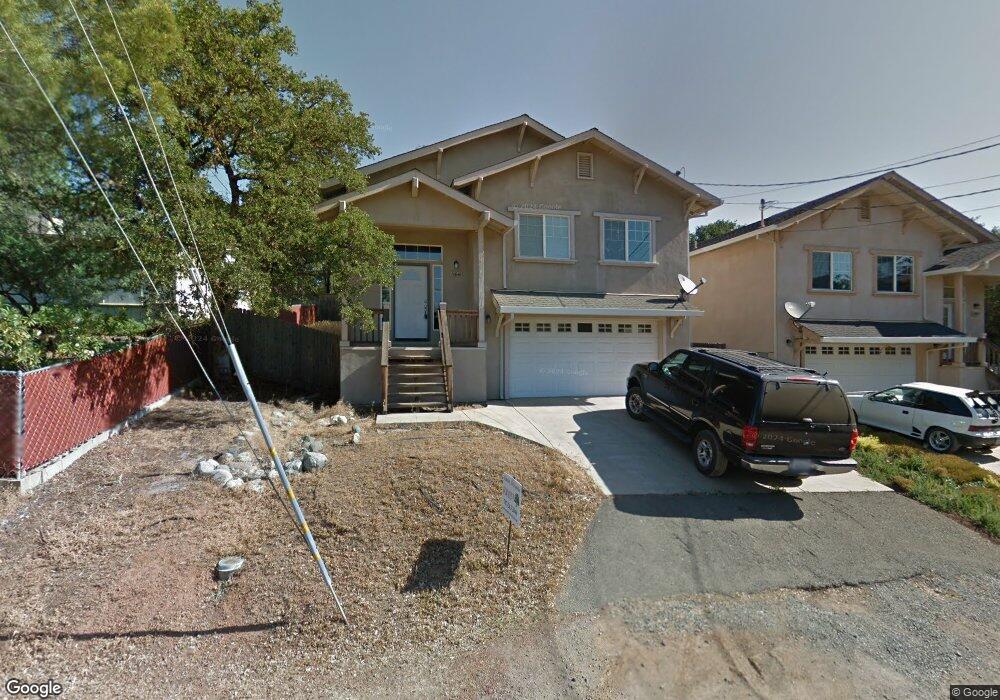
16046 29th Ave Clearlake, CA 95422
Estimated Value: $107,000 - $297,000
3
Beds
2
Baths
1,598
Sq Ft
$143/Sq Ft
Est. Value
About This Home
This home is located at 16046 29th Ave, Clearlake, CA 95422 and is currently estimated at $227,869, approximately $142 per square foot. 16046 29th Ave is a home located in Lake County with nearby schools including Lower Lake High School, Jeannies Learning Garden, and Clearlake Seventh-day Adventist Christian School.
Ownership History
Date
Name
Owned For
Owner Type
Purchase Details
Closed on
Jun 9, 2011
Sold by
Carr Anthony E and Kooi Richard F
Bought by
Equity Trust Co
Current Estimated Value
Purchase Details
Closed on
Jan 16, 2007
Sold by
Kooi Theresa
Bought by
Kooi Richard F
Home Financials for this Owner
Home Financials are based on the most recent Mortgage that was taken out on this home.
Original Mortgage
$185,000
Interest Rate
6.1%
Mortgage Type
Negative Amortization
Purchase Details
Closed on
Dec 19, 2005
Sold by
Sunrise Real Estate Co Inc
Bought by
Sunncarr Development
Home Financials for this Owner
Home Financials are based on the most recent Mortgage that was taken out on this home.
Original Mortgage
$175,000
Interest Rate
6.27%
Mortgage Type
Construction
Create a Home Valuation Report for This Property
The Home Valuation Report is an in-depth analysis detailing your home's value as well as a comparison with similar homes in the area
Purchase History
We collect this data history from publicly available records. To have your information removed, we recommend requesting removal directly through your county’s website.
| Date | Buyer | Sale Price | Title Company |
|---|---|---|---|
| Equity Trust Co | -- | Fidelity National Title Comp | |
| Equity Trust Co | $65,000 | Fidelity National Title Comp | |
| Kooi Richard F | -- | Fidelity National Title Co | |
| Carr Anthony E | -- | Fidelity National Title Co | |
| Carr Anthony E | -- | Fidelity National Title Co | |
| Sunncarr Development | -- | Fidelity National Title |
Source: Public Records
Mortgage History
We collect this data history from publicly available records. To have your information removed, we recommend requesting removal directly through your county’s website.
| Date | Status | Borrower | Loan Amount |
|---|---|---|---|
| Previous Owner | Carr Anthony E | $185,000 | |
| Previous Owner | Sunncarr Development | $175,000 |
Source: Public Records
Tax History
| Year | Tax Paid | Tax Assessment Tax Assessment Total Assessment is a certain percentage of the fair market value that is determined by local assessors to be the total taxable value of land and additions on the property. | Land | Improvement |
|---|---|---|---|---|
| 2025 | $1,084 | $81,631 | $12,555 | $69,076 |
| 2024 | $1,070 | $80,031 | $12,309 | $67,722 |
| 2023 | $1,056 | $78,463 | $12,068 | $66,395 |
| 2022 | $1,002 | $76,926 | $11,832 | $65,094 |
| 2021 | $1,020 | $75,418 | $11,600 | $63,818 |
| 2020 | $1,014 | $74,646 | $11,482 | $63,164 |
| 2019 | $1,405 | $73,183 | $11,257 | $61,926 |
| 2018 | $972 | $71,749 | $11,037 | $60,712 |
| 2017 | $928 | $70,343 | $10,821 | $59,522 |
| 2016 | $831 | $68,964 | $10,609 | $58,355 |
| 2015 | $962 | $67,929 | $10,450 | $57,479 |
| 2014 | $802 | $66,600 | $10,246 | $56,354 |
Source: Public Records
Map
Nearby Homes
Your Personal Tour Guide
Ask me questions while you tour the home.