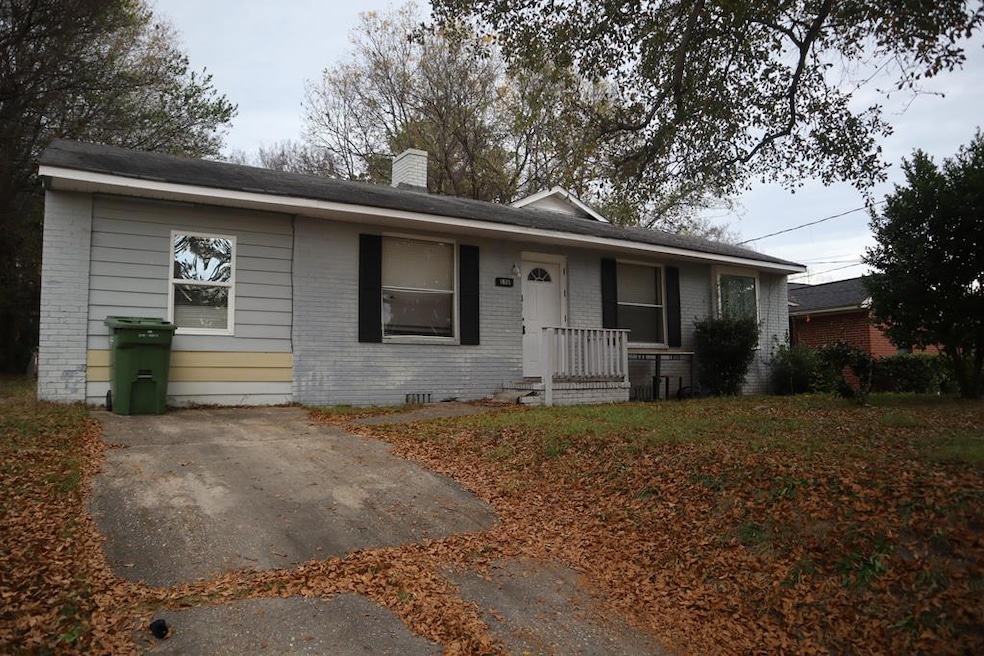

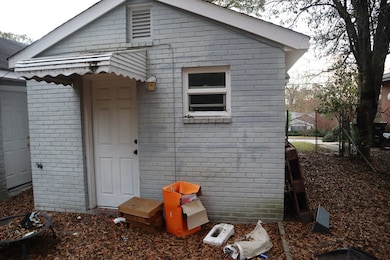
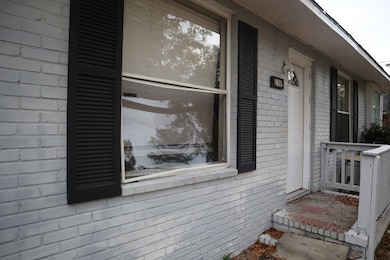
1605 39th St Columbus, GA 31904
North Columbus NeighborhoodEstimated payment $626/month
Highlights
- Wood Flooring
- Cooling Available
- Bungalow
- No HOA
- Laundry Room
- Forced Air Heating System
About This Home
4BR/2.5BA Investment Opportunity in Prime North Columbus! This spacious property is perfectly positioned for investors seeking strong rental potential in a high-demand area. Located just minutes from major shopping, dining, and Fort Benning, this home attracts long-term tenants and offers consistent cash-flow potential. With generous square footage, a functional layout, and unbeatable convenience, this North Columbus property is an ideal addition to any investment portfolio.
Listing Agent
Keller Williams Auburn/Opelika Brokerage Phone: 3342093242 License #429079 Listed on: 12/02/2025

Home Details
Home Type
- Single Family
Est. Annual Taxes
- $6,146
Year Built
- Built in 1946
Lot Details
- 9,148 Sq Ft Lot
- Level Lot
Home Design
- Bungalow
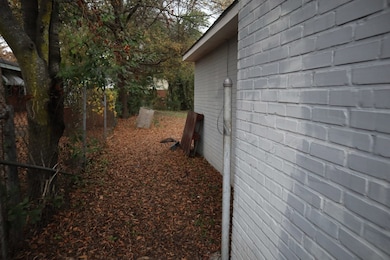
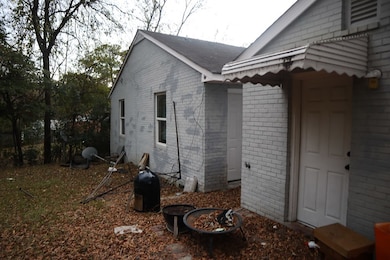
- Fixer Upper
- Brick Exterior Construction
Interior Spaces
- 1,451 Sq Ft Home
- Ceiling Fan
- Fire and Smoke Detector
- Electric Range
- Laundry Room
Flooring
- Wood
- Carpet
Bedrooms and Bathrooms
- 4 Main Level Bedrooms
Parking
- Driveway
- Open Parking
Utilities
- Cooling Available
- Forced Air Heating System
Community Details
- No Home Owners Association
- Sherwood Forest Addition Subdivision
Listing and Financial Details
- Assessor Parcel Number 031 036 007
Map
Home Values in the Area
Average Home Value in this Area
Tax History
| Year | Tax Paid | Tax Assessment Tax Assessment Total Assessment is a certain percentage of the fair market value that is determined by local assessors to be the total taxable value of land and additions on the property. | Land | Improvement |
|---|---|---|---|---|
| 2025 | $6,146 | $44,508 | $7,932 | $36,576 |
| 2024 | $3,834 | $44,508 | $7,932 | $36,576 |
| 2023 | $1,753 | $44,508 | $7,932 | $36,576 |
| 2022 | $1,019 | $24,956 | $7,932 | $17,024 |
| 2021 | $1,019 | $24,956 | $7,932 | $17,024 |
| 2020 | $1,114 | $32,084 | $7,932 | $24,152 |
| 2019 | $1,195 | $29,164 | $7,291 | $21,873 |
| 2018 | $1,195 | $29,164 | $7,291 | $21,873 |
| 2017 | $1,199 | $29,164 | $7,291 | $21,873 |
| 2016 | $1,199 | $29,066 | $2,387 | $26,679 |
| 2015 | $1,200 | $29,066 | $2,387 | $26,679 |
| 2014 | $1,202 | $29,066 | $2,387 | $26,679 |
| 2013 | -- | $29,066 | $2,387 | $26,679 |
Property History
| Date | Event | Price | List to Sale | Price per Sq Ft |
|---|---|---|---|---|
| 12/02/2025 12/02/25 | For Sale | $99,900 | -- | $69 / Sq Ft |
Purchase History
| Date | Type | Sale Price | Title Company |
|---|---|---|---|
| Quit Claim Deed | -- | None Listed On Document |
Source: Columbus Board of REALTORS® (GA)
MLS Number: 224767
APN: 031-036-007
Disclaimer: Certain information contained herein is derived from information provided by parties other than Homes.com. All information provided is deemed reliable, but is not guaranteed to be accurate and should be independently verified.
![]() IDX information is provided exclusively for personal, non-commercial use, and may not be used for any purpose other than to identify prospective properties consumers may be interested in purchasing. Information is deemed reliable but not guaranteed.
IDX information is provided exclusively for personal, non-commercial use, and may not be used for any purpose other than to identify prospective properties consumers may be interested in purchasing. Information is deemed reliable but not guaranteed.
- 1703 39th St
- 4109 Sherwood Ave
- 1717 42nd St
- 3905 Crestview Dr
- 4220 18th Ave
- 1918 Rosemont Dr
- 3643 Calvin Dr
- 2012 42nd St
- 2122 40th St
- 0 Warm Springs Rd
- 2021 Elgin Dr
- 3305 Cherokee Ave
- 2257 Camille Dr
- 3604 23rd Ave
- 3111 15th Ave
- 1810 Shannon Dr
- 3609 Hamilton Rd
- 1705 Slade Dr
- 4717 16th Ave
- 3232 Hillside Way
- 1703 39th St Unit B
- 3920 Howard Ave
- 3912 Crestview Dr Unit ID1043628P
- 3912 Crestview Dr Unit ID1043607P
- 3912 Crestview Dr Unit ID1043661P
- 3912 Crestview Dr Unit ID1043585P
- 3813 Howard Ave
- 3561 Hilton Ave
- 3981 Holly Ave Unit 8
- 3113 Cherokee Ave
- 4809 16th Ave
- 4223 Rosemont Dr Unit 3
- 4830 19th Ave
- 1410 Talbotton Rd
- 2932 13th Ave
- 3000 11th Ave
- 4629 Rosemont Dr Unit ID1043476P
- 4629 Rosemont Dr Unit ID1043904P
- 3821 Armour Ave
- 3711 Armour Ave