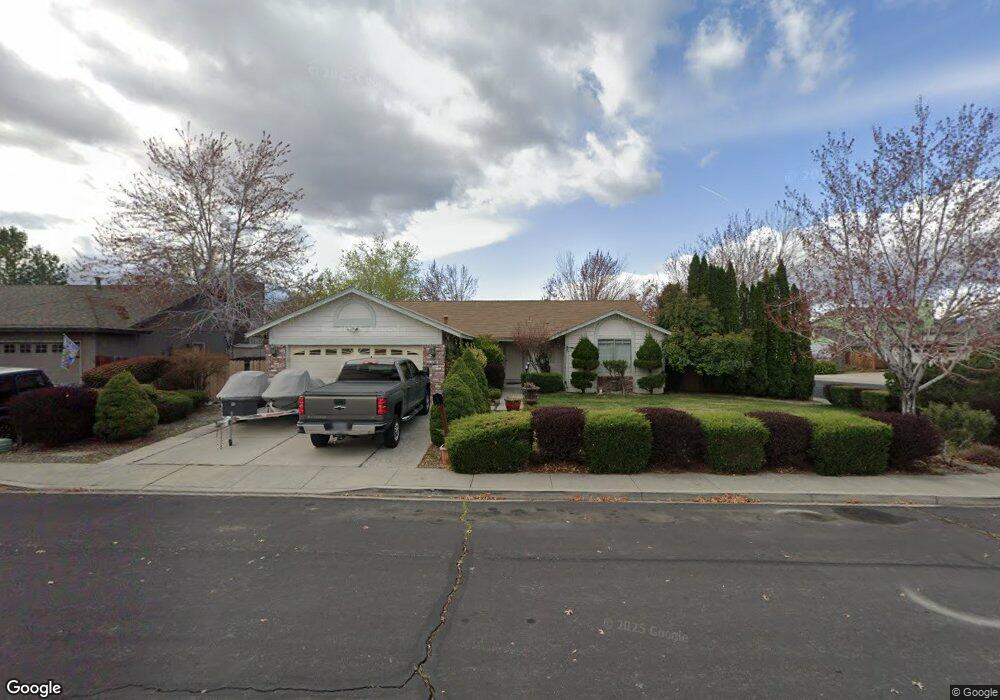
1605 Atlantic Way Sparks, NV 89434
Reed NeighborhoodEstimated Value: $474,000 - $507,000
3
Beds
2
Baths
1,648
Sq Ft
$296/Sq Ft
Est. Value
About This Home
This home is located at 1605 Atlantic Way, Sparks, NV 89434 and is currently estimated at $488,273, approximately $296 per square foot. 1605 Atlantic Way is a home located in Washoe County with nearby schools including Lloyd Diedrichsen Elementary School, Lou Mendive Middle School, and Edward C Reed High School.
Ownership History
Date
Name
Owned For
Owner Type
Purchase Details
Closed on
Aug 16, 2007
Sold by
Tran James D and Tran Tracy T
Bought by
Marsh Madden Christine A and Christine Madden Living Trust
Current Estimated Value
Purchase Details
Closed on
Feb 2, 2000
Sold by
Trieu Quang Dong and Nguyen Vui Kim Thi
Bought by
Tran James D and Tran Tracy T
Home Financials for this Owner
Home Financials are based on the most recent Mortgage that was taken out on this home.
Original Mortgage
$127,500
Interest Rate
8.87%
Purchase Details
Closed on
Jan 26, 1994
Sold by
Trieu Quang D and Trieu Dong H
Bought by
Trieu Quang Dong and Nguyen Vui Kim Thi
Home Financials for this Owner
Home Financials are based on the most recent Mortgage that was taken out on this home.
Original Mortgage
$90,000
Interest Rate
7.21%
Create a Home Valuation Report for This Property
The Home Valuation Report is an in-depth analysis detailing your home's value as well as a comparison with similar homes in the area
Home Values in the Area
Average Home Value in this Area
Purchase History
| Date | Buyer | Sale Price | Title Company |
|---|---|---|---|
| Marsh Madden Christine A | $303,000 | Stewart Title Of Northern Nv | |
| Tran James D | $150,000 | Stewart Title Company | |
| Trieu Quang Dong | $33,500 | Stewart Title |
Source: Public Records
Mortgage History
| Date | Status | Borrower | Loan Amount |
|---|---|---|---|
| Previous Owner | Tran James D | $127,500 | |
| Previous Owner | Trieu Quang Dong | $90,000 |
Source: Public Records
Tax History Compared to Growth
Tax History
| Year | Tax Paid | Tax Assessment Tax Assessment Total Assessment is a certain percentage of the fair market value that is determined by local assessors to be the total taxable value of land and additions on the property. | Land | Improvement |
|---|---|---|---|---|
| 2026 | $1,959 | $86,328 | $36,890 | $49,438 |
| 2025 | $2,544 | $86,776 | $36,120 | $50,656 |
| 2024 | $2,472 | $84,588 | $33,215 | $51,373 |
| 2023 | $2,472 | $84,110 | $35,175 | $48,935 |
| 2022 | $2,290 | $67,710 | $26,740 | $40,970 |
| 2021 | $2,224 | $62,784 | $21,735 | $41,049 |
| 2020 | $2,090 | $62,076 | $20,720 | $41,356 |
| 2019 | $1,990 | $60,930 | $20,720 | $40,210 |
| 2018 | $1,900 | $54,033 | $14,455 | $39,578 |
| 2017 | $1,825 | $53,556 | $13,720 | $39,836 |
| 2016 | $1,780 | $52,956 | $12,250 | $40,706 |
| 2015 | $1,781 | $51,246 | $10,325 | $40,921 |
| 2014 | $1,723 | $48,621 | $9,030 | $39,591 |
| 2013 | -- | $46,035 | $6,860 | $39,175 |
Source: Public Records
Map
Nearby Homes
- 1866 Pocono Ct
- 2002 Wabash Cir
- 1345 Coupler Ct
- 1770 Burnside Dr
- 1332 Coachman Ct
- 1005 Amico Dr
- 1290 Highgate Ct
- 1218 Junction Dr
- 2119 Avella Dr
- 1544 Woodhaven Ln
- 1757 Bluehaven Dr
- 1990 Fargo Way
- 1280 O'Callaghan Dr
- 2252 Sycamore Glen Dr
- 2159 Meritage Dr
- 675 Parlanti Ln Unit 52
- 675 Parlanti Ln Unit 124
- 675 Parlanti Ln Unit 42
- 675 Parlanti Ln
- 675 Parlanti Ln Unit 88
- 1635 Atlantic Way
- 1665 Atlantic Way
- 941 Railborne Dr
- 935 Railborne Dr
- 1604 Atlantic Way
- 905 Railborne Dr
- 945 Railborne Dr
- 1634 Atlantic Way
- 931 Railborne Dr
- 1664 Atlantic Way
- 921 Railborne Dr
- 925 Railborne Dr
- 951 Railborne Dr
- 1695 Atlantic Way
- 915 Railborne Dr
- 911 Railborne Dr
- 905 Locomotive Way Unit 10
- 915 Locomotive Way
- 1694 Atlantic Way
- 955 Railborne Dr