
Seller's Agent in 2019
Will Puente
Savvy Way Realty
(888) 909-9914
615 Total Sales

Estimated Value: $373,609 - $435,000
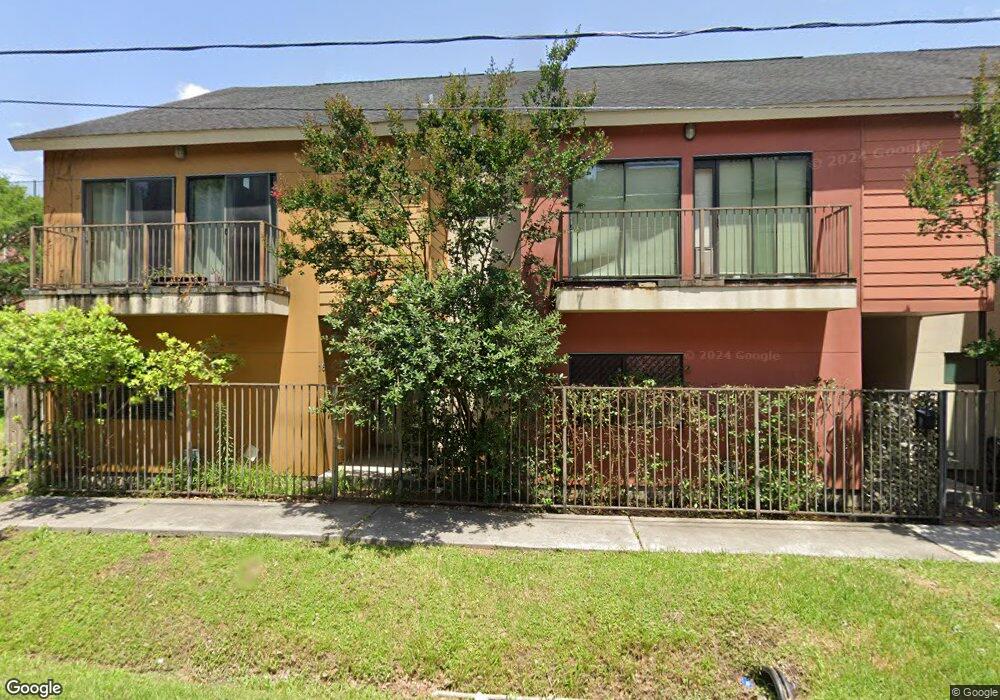
Immaculate, modern 3-story townhome, steps away from LA Fitness, Sprouts, Starbucks, and so much more. Gleaming hardwood floors, stainless steel appliances, granite countertops, open concept kitchen/living room, perfect for entertaining. Walk-in closets, second story balcony, jacuzzi tub in maser bathroom. Perfect location, next to I-10, close to Allen Parkway and the Heights. Corner unit, large garage with room for ample storage. Move-in ready!
| Date | Buyer | Sale Price | Title Company |
|---|---|---|---|
| Ede Andrew J | -- | None Listed On Document | |
| Ede Andrew J | -- | None Available | |
| Irshad Habib | -- | Startex Title Company | |
| Paukert James L | -- | Partners Title Company |
| Date | Status | Borrower | Loan Amount |
|---|---|---|---|
| Previous Owner | Ede Andrew J | $160,000 | |
| Previous Owner | Paukert James L | $174,720 |
| Date | Event | Price | List to Sale | Price per Sq Ft |
|---|---|---|---|---|
| 12/30/2021 12/30/21 | Off Market | -- | -- | -- |
| 02/04/2019 02/04/19 | Sold | -- | -- | -- |
| 01/05/2019 01/05/19 | Pending | -- | -- | -- |
| 01/03/2019 01/03/19 | For Sale | $325,000 | -- | $176 / Sq Ft |
| Year | Tax Paid | Tax Assessment Tax Assessment Total Assessment is a certain percentage of the fair market value that is determined by local assessors to be the total taxable value of land and additions on the property. | Land | Improvement |
|---|---|---|---|---|
| 2025 | $7,722 | $379,413 | $128,945 | $250,468 |
| 2024 | $7,722 | $369,064 | $98,605 | $270,459 |
| 2023 | $7,722 | $343,158 | $98,605 | $244,553 |
| 2022 | $6,716 | $305,032 | $91,020 | $214,012 |
| 2021 | $6,837 | $293,339 | $91,020 | $202,319 |
| 2020 | $6,979 | $288,212 | $91,020 | $197,192 |
| 2019 | $7,886 | $311,660 | $112,865 | $198,795 |
| 2018 | $5,815 | $300,657 | $112,865 | $187,792 |
| 2017 | $7,602 | $300,657 | $112,865 | $187,792 |
| 2016 | $7,602 | $300,657 | $112,865 | $187,792 |
| 2015 | $5,221 | $327,655 | $112,865 | $214,790 |
| 2014 | $5,221 | $275,626 | $112,865 | $162,761 |
Seller's Agent in 2019
Will Puente
Savvy Way Realty
(888) 909-9914
615 Total Sales
A
Buyer's Agent in 2019
Alexander Barrios
eXp Realty LLC
(832) 982-3597
60 Total Sales
Source: Houston Association of REALTORS®
MLS Number: 3877348
APN: 1247500010004
Disclaimer: Certain information contained herein is derived from information provided by parties other than Homes.com. All information provided is deemed reliable, but is not guaranteed to be accurate and should be independently verified.
![]() Copyright 2026, Houston REALTORS® Information Service, Inc.
Copyright 2026, Houston REALTORS® Information Service, Inc.
The information provided is exclusively for consumers’ personal, non-commercial use, and may not be used for any purpose other than to identify prospective properties consumers may be interested in purchasing.
Information is deemed reliable but not guaranteed.
Ask me questions while you tour the home.