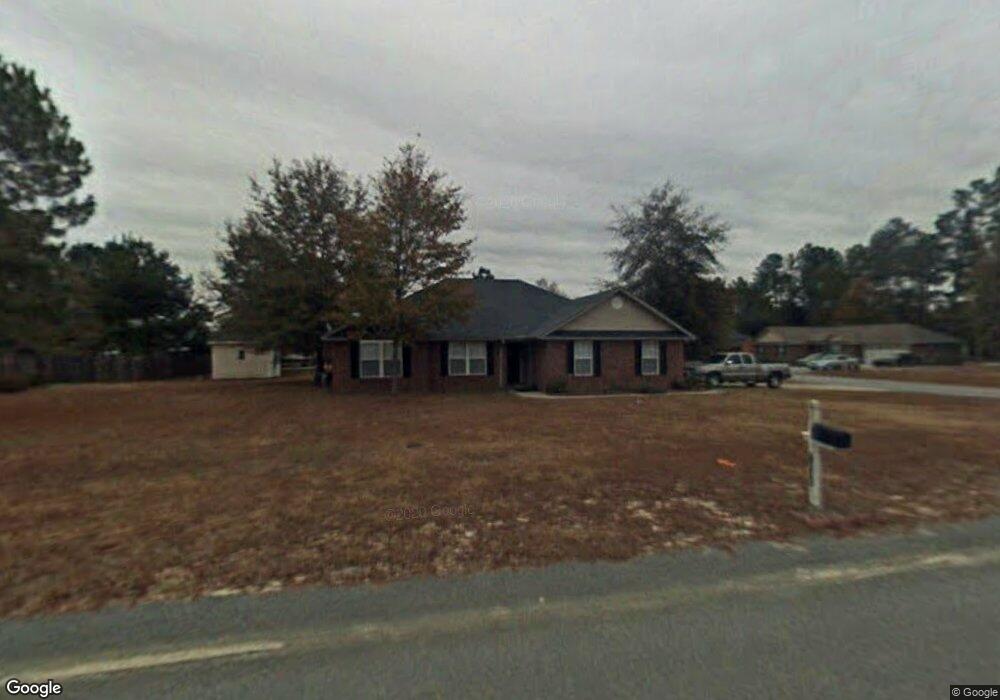
1605 Carissa Dr Sumter, SC 29154
Estimated Value: $237,641 - $258,000
3
Beds
2
Baths
1,634
Sq Ft
$150/Sq Ft
Est. Value
About This Home
This home is located at 1605 Carissa Dr, Sumter, SC 29154 and is currently estimated at $245,910, approximately $150 per square foot. 1605 Carissa Dr is a home located in Sumter County with nearby schools including Oakland Primary School, Shaw Heights Elementary School, and High Hills Elementary School.
Ownership History
Date
Name
Owned For
Owner Type
Purchase Details
Closed on
Mar 4, 2020
Sold by
Edwards Kenneth Daniel
Bought by
Knudson Courtney Jean
Current Estimated Value
Home Financials for this Owner
Home Financials are based on the most recent Mortgage that was taken out on this home.
Original Mortgage
$156,610
Outstanding Balance
$138,701
Interest Rate
3.5%
Mortgage Type
FHA
Estimated Equity
$107,209
Purchase Details
Closed on
Jul 10, 2018
Sold by
Linkous Christopher D
Bought by
Edwards Kenneth Daniel
Home Financials for this Owner
Home Financials are based on the most recent Mortgage that was taken out on this home.
Original Mortgage
$145,000
Interest Rate
4.5%
Mortgage Type
VA
Purchase Details
Closed on
May 6, 2011
Sold by
Linkous Christopher D
Bought by
Linkous Angela
Purchase Details
Closed on
Aug 31, 2006
Sold by
Rainey Lutrelle D and Rainey Eleanor Q
Bought by
Linkous Christopher D and Linkous Angela M
Create a Home Valuation Report for This Property
The Home Valuation Report is an in-depth analysis detailing your home's value as well as a comparison with similar homes in the area
Home Values in the Area
Average Home Value in this Area
Purchase History
| Date | Buyer | Sale Price | Title Company |
|---|---|---|---|
| Knudson Courtney Jean | $159,500 | None Available | |
| Edwards Kenneth Daniel | $145,000 | None Availables | |
| Linkous Angela | $2,000 | -- | |
| Linkous Christopher D | $138,900 | None Available |
Source: Public Records
Mortgage History
| Date | Status | Borrower | Loan Amount |
|---|---|---|---|
| Open | Knudson Courtney Jean | $156,610 | |
| Previous Owner | Edwards Kenneth Daniel | $145,000 |
Source: Public Records
Tax History Compared to Growth
Tax History
| Year | Tax Paid | Tax Assessment Tax Assessment Total Assessment is a certain percentage of the fair market value that is determined by local assessors to be the total taxable value of land and additions on the property. | Land | Improvement |
|---|---|---|---|---|
| 2024 | $1,066 | $6,660 | $960 | $5,700 |
| 2023 | $1,066 | $6,660 | $960 | $5,700 |
| 2022 | $1,065 | $6,660 | $960 | $5,700 |
| 2021 | $1,066 | $6,660 | $960 | $5,700 |
| 2020 | $1,045 | $6,200 | $960 | $5,240 |
| 2019 | $1,020 | $6,200 | $960 | $5,240 |
| 2018 | $945 | $6,120 | $960 | $5,160 |
| 2017 | $3,048 | $9,190 | $1,440 | $7,750 |
| 2016 | $991 | $6,120 | $960 | $5,160 |
| 2015 | $959 | $6,070 | $1,000 | $5,070 |
| 2014 | $959 | $5,870 | $1,000 | $4,870 |
| 2013 | -- | $5,870 | $1,000 | $4,870 |
Source: Public Records
Map
Nearby Homes
- 1635 Carissa Dr
- 3740 Oleander Dr
- 3315 Oleander Dr
- 1625 & 1645 Suber St
- 3389 Wilton Dr
- 3105 Oleander Dr
- 3720 Vinca St
- 60 Vinca Ct
- 3240 Debidue Ln
- 3230 Debidue Ln
- 3061 Broad St
- 1245 Dewees St
- 1928 Flagpole Dr Unit Lot 459
- Trenton Plan at Canopy of Oaks - Canopy Of Oaks @ Hunter's Crossing
- Brentwood Plan at Canopy of Oaks - Canopy Of Oaks @ Hunter's Crossing
- Langley Plan at Canopy of Oaks - Canopy Of Oaks @ Hunter's Crossing
- Benjamin Plan at Canopy of Oaks - Canopy Of Oaks @ Hunter's Crossing
- Dean Plan at Canopy of Oaks - Canopy Of Oaks @ Hunter's Crossing
- Maddox Plan at Canopy of Oaks - Canopy Of Oaks @ Hunter's Crossing
- Pittman Plan at Canopy of Oaks - Canopy Of Oaks @ Hunter's Crossing
- 3585 Oleander Dr
- 1615 Carissa Dr
- 3605 Oleander Dr
- 1600 Yaupon St
- 1600 Carissa Dr
- 3590 Oleander Dr
- 1610 Yaupon St
- 1600 Yaupon Dr
- 3580 Oleander Dr
- 1610 Carissa Dr
- 1610 Yaupon Dr
- 3600 Oleander Dr
- 1625 Carissa Dr
- 3570 Oleander Dr
- 1620 Yaupon St
- 1620 Carissa Dr
- 1620 Yaupon Dr
- 3625 Oleander Dr
- 3560 Oleander Dr
- 1630 Yaupon St