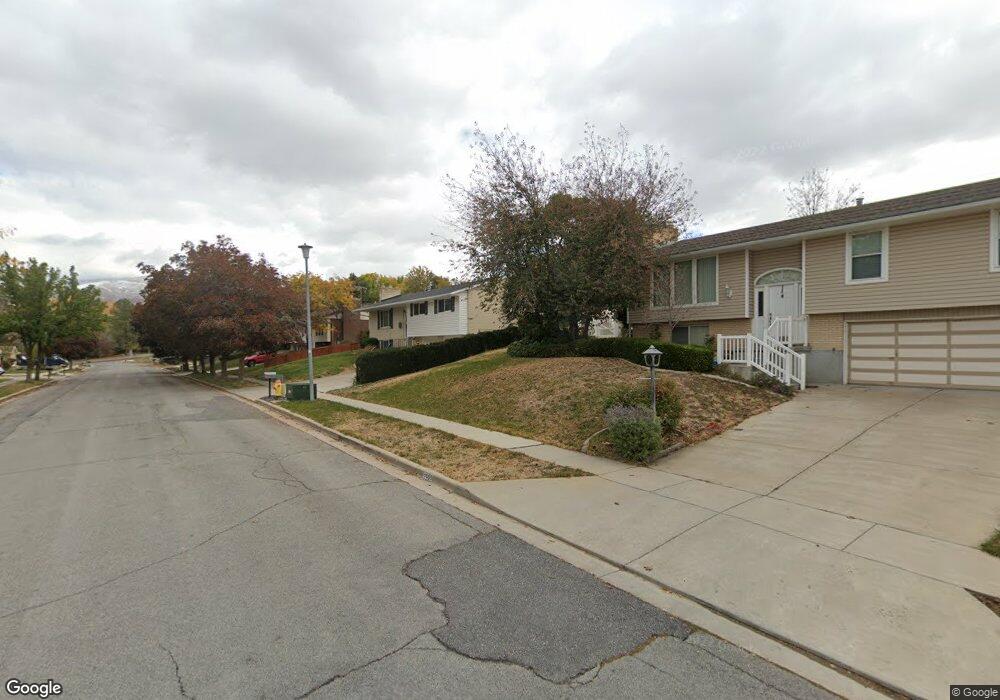
1605 Charlene Dr Bountiful, UT 84010
Estimated Value: $513,000 - $522,430
3
Beds
3
Baths
1,350
Sq Ft
$384/Sq Ft
Est. Value
About This Home
This home is located at 1605 Charlene Dr, Bountiful, UT 84010 and is currently estimated at $518,358, approximately $383 per square foot. 1605 Charlene Dr is a home located in Davis County with nearby schools including Valley View School, Mueller Park Junior High School, and Bountiful High School.
Ownership History
Date
Name
Owned For
Owner Type
Purchase Details
Closed on
Mar 30, 2020
Sold by
Adair Kenneth
Bought by
Adair Kenneth J
Current Estimated Value
Home Financials for this Owner
Home Financials are based on the most recent Mortgage that was taken out on this home.
Original Mortgage
$228,500
Outstanding Balance
$201,983
Interest Rate
3.4%
Mortgage Type
New Conventional
Estimated Equity
$316,375
Purchase Details
Closed on
Jun 18, 2018
Sold by
Walpole Virginia
Bought by
Adair Kenneth
Home Financials for this Owner
Home Financials are based on the most recent Mortgage that was taken out on this home.
Original Mortgage
$230,000
Interest Rate
4.5%
Mortgage Type
New Conventional
Purchase Details
Closed on
Aug 5, 2008
Sold by
Walpole Lucy B and Virginia Adair L
Bought by
Walpole Virginia
Purchase Details
Closed on
Aug 9, 1999
Sold by
Walpole Lucy B and Virginia Adair L
Bought by
Walpole Virginia
Purchase Details
Closed on
Aug 7, 1999
Sold by
Troseth David A and Troseth Patricia A
Bought by
Walpole Lucy B and Virginia Adair L
Create a Home Valuation Report for This Property
The Home Valuation Report is an in-depth analysis detailing your home's value as well as a comparison with similar homes in the area
Purchase History
| Date | Buyer | Sale Price | Title Company |
|---|---|---|---|
| Adair Kenneth J | -- | Backman Title Ser | |
| Adair Kenneth | -- | North American Title | |
| Walpole Virginia | -- | None Available | |
| Walpole Virginia | -- | Equity Title Agency | |
| Walpole Lucy B | -- | Equity Title Agency |
Source: Public Records
Mortgage History
| Date | Status | Borrower | Loan Amount |
|---|---|---|---|
| Open | Adair Kenneth J | $228,500 | |
| Closed | Adair Kenneth | $230,000 |
Source: Public Records
Tax History
| Year | Tax Paid | Tax Assessment Tax Assessment Total Assessment is a certain percentage of the fair market value that is determined by local assessors to be the total taxable value of land and additions on the property. | Land | Improvement |
|---|---|---|---|---|
| 2025 | $2,855 | $258,500 | $125,246 | $133,254 |
| 2024 | $2,804 | $264,550 | $115,606 | $148,944 |
| 2023 | $2,705 | $463,000 | $207,932 | $255,068 |
| 2022 | $2,803 | $263,450 | $110,488 | $152,962 |
| 2021 | $2,566 | $369,000 | $164,075 | $204,925 |
| 2020 | $2,157 | $310,000 | $149,436 | $160,564 |
| 2019 | $2,179 | $306,000 | $150,969 | $155,031 |
| 2018 | $2,001 | $276,000 | $139,725 | $136,275 |
| 2016 | $1,746 | $130,461 | $43,863 | $86,598 |
| 2015 | $1,717 | $121,166 | $43,863 | $77,303 |
| 2014 | $1,688 | $122,603 | $43,863 | $78,740 |
| 2013 | -- | $117,686 | $43,668 | $74,018 |
Source: Public Records
Map
Nearby Homes
- 771 E 1825 S
- 795 Abby Ln Unit 5
- 631 E 1700 S
- 861 E Millbrook Way
- 1087 Arlington Way
- 438 E 1800 S
- 1886 S Jeri Dr
- 380 E 1500 S
- 1997 S 800 E
- 288 E 1650 S
- 2136 Elaine Dr
- 626 E 2150 S
- 2059 S 350 E Unit 6
- 842 E 2150 S
- 2038 S 350 E Unit 3
- 291 E 1950 S
- 2046 S 350 E Unit 4
- 257 E 2050 S
- 141 E 1650 S
- 320 E 2100 S
- 1603 Charlene Dr
- 1627 Charlene Dr
- 1638 Emerald Hills Dr
- 1602 Emerald Hills Dr
- 1648 Emerald Hills Dr
- 1604 Charlene Dr
- 1577 Charlene Dr
- 1643 Charlene Dr
- 1588 Charlene Dr
- 1624 Charlene Dr
- 1576 Emerald Hills Dr
- 799 Emerald Hills Dr
- 1572 Charlene Dr
- 1561 Charlene Dr
- 1621 Emerald Hills Dr
- 760 Charlene Dr
- 1641 Emerald Hills Dr
- 1593 S Davis Blvd
- 743 Charlene Dr
- 1601 Emerald Hills Dr
Your Personal Tour Guide
Ask me questions while you tour the home.