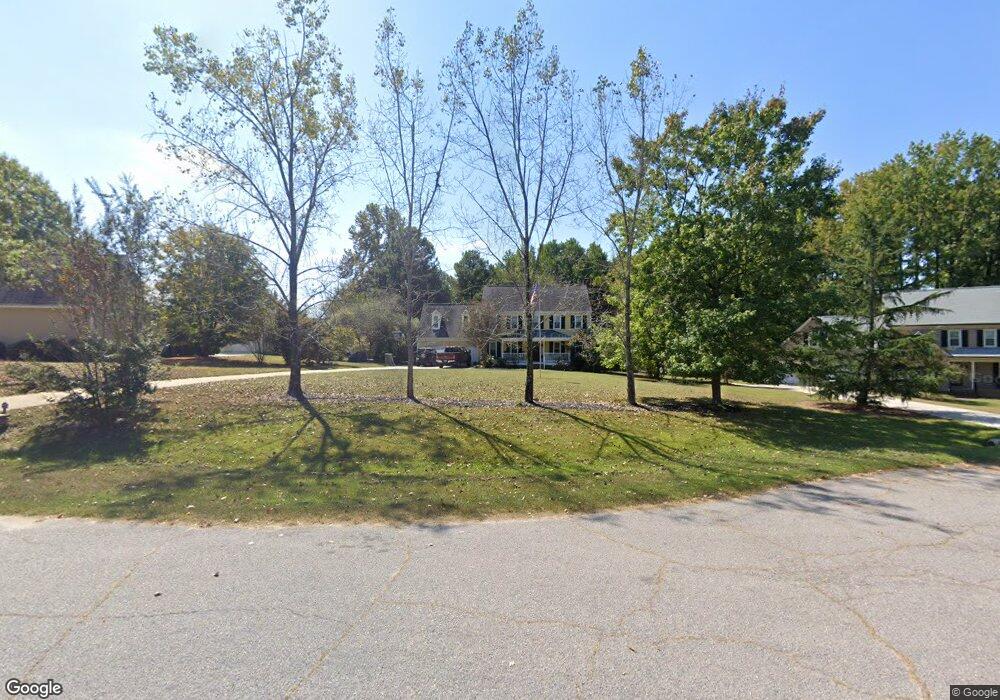
1605 Eagon Ct Fuquay Varina, NC 27526
Estimated Value: $492,000 - $564,000
3
Beds
3
Baths
2,430
Sq Ft
$219/Sq Ft
Est. Value
About This Home
This home is located at 1605 Eagon Ct, Fuquay Varina, NC 27526 and is currently estimated at $533,358, approximately $219 per square foot. 1605 Eagon Ct is a home located in Wake County with nearby schools including Fuquay-Varina High, Southern Wake Academy, and New School Montessori Center.
Ownership History
Date
Name
Owned For
Owner Type
Purchase Details
Closed on
Aug 4, 2017
Sold by
Lingenfelser Joshua P and Lingenfelser Amy C
Bought by
Bowers Joshua A and Bowers Kristen N
Current Estimated Value
Home Financials for this Owner
Home Financials are based on the most recent Mortgage that was taken out on this home.
Original Mortgage
$311,557
Outstanding Balance
$259,407
Interest Rate
3.88%
Mortgage Type
VA
Estimated Equity
$273,951
Purchase Details
Closed on
May 4, 2010
Sold by
The Bank Of New York Mellon
Bought by
Lingenfelser Joshua P and Lingenfelser Amy C
Home Financials for this Owner
Home Financials are based on the most recent Mortgage that was taken out on this home.
Original Mortgage
$163,200
Interest Rate
5.03%
Mortgage Type
New Conventional
Purchase Details
Closed on
Nov 25, 2009
Sold by
Mcgregor Russell D and Mcgregor Marion J
Bought by
The Bank Of New York Mellon and The Bank Of New York
Create a Home Valuation Report for This Property
The Home Valuation Report is an in-depth analysis detailing your home's value as well as a comparison with similar homes in the area
Home Values in the Area
Average Home Value in this Area
Purchase History
| Date | Buyer | Sale Price | Title Company |
|---|---|---|---|
| Bowers Joshua A | $305,000 | None Available | |
| Lingenfelser Joshua P | $204,000 | None Available | |
| The Bank Of New York Mellon | $216,000 | None Available |
Source: Public Records
Mortgage History
| Date | Status | Borrower | Loan Amount |
|---|---|---|---|
| Open | Bowers Joshua A | $311,557 | |
| Previous Owner | Lingenfelser Joshua P | $163,200 |
Source: Public Records
Tax History Compared to Growth
Tax History
| Year | Tax Paid | Tax Assessment Tax Assessment Total Assessment is a certain percentage of the fair market value that is determined by local assessors to be the total taxable value of land and additions on the property. | Land | Improvement |
|---|---|---|---|---|
| 2025 | $2,634 | $453,730 | $110,000 | $343,730 |
| 2024 | $2,558 | $453,730 | $110,000 | $343,730 |
| 2023 | $2,150 | $318,197 | $65,000 | $253,197 |
| 2022 | $2,318 | $318,197 | $65,000 | $253,197 |
| 2021 | $2,256 | $318,197 | $65,000 | $253,197 |
| 2020 | $2,219 | $318,197 | $65,000 | $253,197 |
| 2019 | $2,165 | $262,635 | $70,000 | $192,635 |
| 2018 | $1,991 | $262,635 | $70,000 | $192,635 |
| 2017 | $1,784 | $248,093 | $70,000 | $178,093 |
| 2016 | $1,748 | $248,093 | $70,000 | $178,093 |
| 2015 | $1,747 | $248,663 | $70,000 | $178,663 |
| 2014 | $1,656 | $248,663 | $70,000 | $178,663 |
Source: Public Records
Map
Nearby Homes
- 3017 White Rail Dr
- 2507 Belvinwood Dr
- 2403 Adrift Rd
- 2406 Belvinwood Dr
- 2415 Adrift Rd
- 2412 Adrift Rd
- 2404 Adrift Rd
- 2400 Adrift Rd
- 2401 Adrift Rd
- 807 Fireship Rd
- 809 Fireship Rd
- 2408 Adrift Rd
- 803 Fireship Rd
- 805 Fireship Rd
- 801 Fireship Rd
- 139 Stone Nut Trail
- Atlas End Unit Plan at Atwater Station - Midtown Collection
- Cora End Unit Plan at Atwater Station - Midtown Collection
- Willow Plan at Atwater Station - Village Collection
- Atlas Interior Unit Plan at Atwater Station - Midtown Collection
- 5432 Lafayette Dr
- 1609 Eagon Ct
- 5436 Lafayette Dr
- 1517 Bass Lake Rd
- 1612 Eagon Ct
- 1600 Eagon Ct
- 1604 Eagon Ct
- 5433 Lafayette Dr
- 5437 Lafayette Dr
- 1513 Bass Lake Rd
- 1608 Eagon Ct
- X Lafayette Dr
- 5441 Lafayette Dr
- 5429 Lafayette Dr
- 5420 Lafayette Dr
- 1501 Bass Lake Rd
- 4920 Flathead Place
- 4836 Ozark St
- 4924 Flathead Place
- 4917 Flathead Place