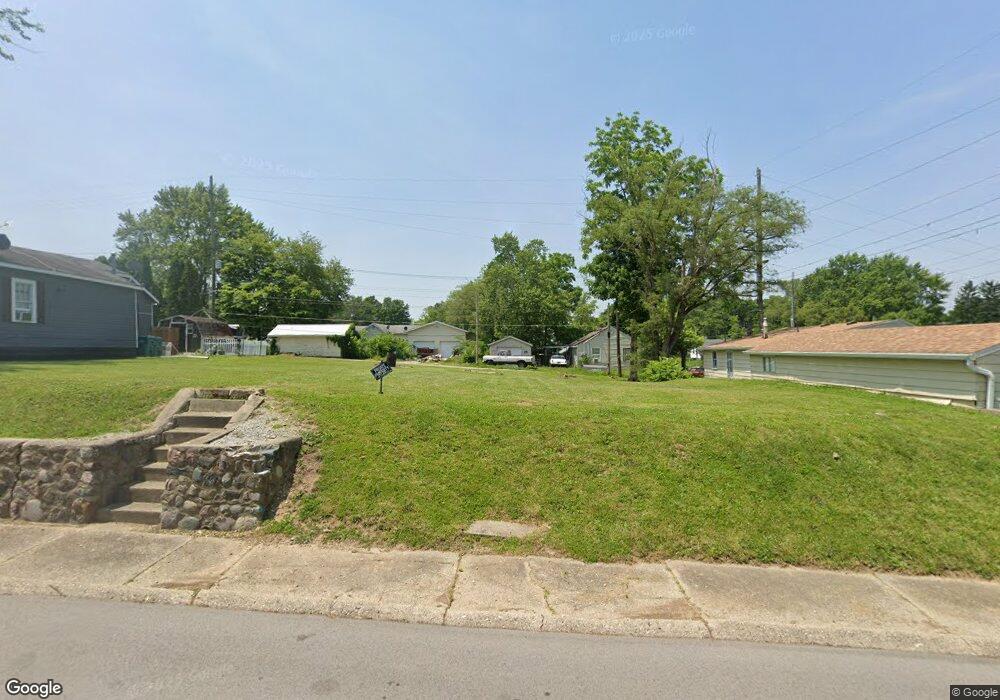
1605 Irvin St New Castle, IN 47362
Estimated Value: $112,000 - $152,000
2
Beds
1
Bath
1,140
Sq Ft
$115/Sq Ft
Est. Value
About This Home
This home is located at 1605 Irvin St, New Castle, IN 47362 and is currently estimated at $131,667, approximately $115 per square foot. 1605 Irvin St is a home located in Henry County with nearby schools including Agape Learning Center.
Ownership History
Date
Name
Owned For
Owner Type
Purchase Details
Closed on
Mar 17, 2020
Sold by
New Castle Housing Authority
Bought by
Criswell Bradley S
Current Estimated Value
Purchase Details
Closed on
Aug 20, 2018
Sold by
City Of New Castle
Bought by
New Castle Housing Authority
Purchase Details
Closed on
Apr 6, 2018
Sold by
Auditor
Bought by
New Of
Purchase Details
Closed on
Mar 27, 2018
Sold by
Luellen David C and Luellen Dianna
Bought by
City Of New Castle
Create a Home Valuation Report for This Property
The Home Valuation Report is an in-depth analysis detailing your home's value as well as a comparison with similar homes in the area
Home Values in the Area
Average Home Value in this Area
Purchase History
| Date | Buyer | Sale Price | Title Company |
|---|---|---|---|
| Criswell Bradley S | -- | None Available | |
| New Castle Housing Authority | -- | None Available | |
| New Of | -- | -- | |
| City Of New Castle | -- | None Available |
Source: Public Records
Tax History Compared to Growth
Tax History
| Year | Tax Paid | Tax Assessment Tax Assessment Total Assessment is a certain percentage of the fair market value that is determined by local assessors to be the total taxable value of land and additions on the property. | Land | Improvement |
|---|---|---|---|---|
| 2024 | $160 | $8,000 | $8,000 | $0 |
| 2023 | $240 | $8,000 | $8,000 | $0 |
| 2022 | $159 | $5,300 | $5,300 | $0 |
| 2021 | $138 | $4,600 | $4,600 | $0 |
| 2020 | $161 | $0 | $0 | $0 |
| 2019 | $161 | $0 | $0 | $0 |
| 2018 | $161 | $7,900 | $4,600 | $3,300 |
| 2017 | $239 | $7,900 | $4,600 | $3,300 |
| 2016 | $216 | $7,900 | $4,600 | $3,300 |
| 2014 | $518 | $25,800 | $4,600 | $21,200 |
| 2013 | $518 | $27,700 | $4,600 | $23,100 |
Source: Public Records
Map
Nearby Homes