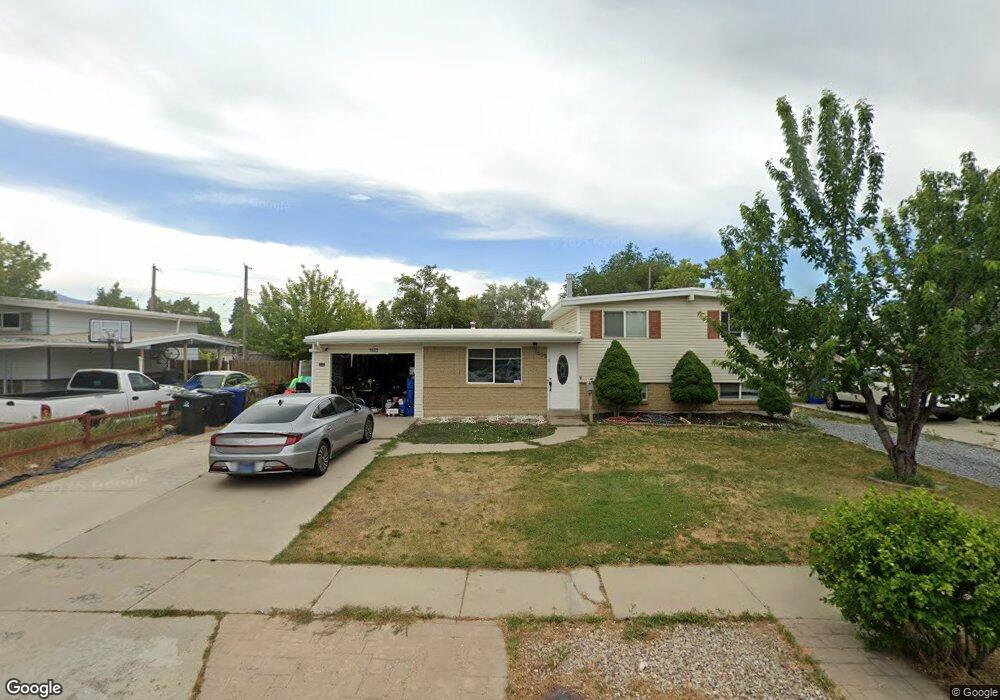
1605 Lovely Rd Salt Lake City, UT 84123
Estimated Value: $455,000 - $479,673
4
Beds
2
Baths
1,708
Sq Ft
$274/Sq Ft
Est. Value
About This Home
This home is located at 1605 Lovely Rd, Salt Lake City, UT 84123 and is currently estimated at $467,168, approximately $273 per square foot. 1605 Lovely Rd is a home located in Salt Lake County with nearby schools including Plymouth Elementary School, Eisenhower Jr High School, and Taylorsville High School.
Ownership History
Date
Name
Owned For
Owner Type
Purchase Details
Closed on
Nov 29, 2021
Sold by
Jolley Taylor and Jolley Megan
Bought by
Sfr Acquisitions 1 Llc
Current Estimated Value
Purchase Details
Closed on
Aug 5, 2020
Sold by
Peavey Onstad Lenae
Bought by
Jolley Taylor and Jolley Megan
Home Financials for this Owner
Home Financials are based on the most recent Mortgage that was taken out on this home.
Original Mortgage
$244,000
Interest Rate
3.1%
Mortgage Type
New Conventional
Purchase Details
Closed on
Dec 21, 2012
Sold by
Peavey Onstad Lenae
Bought by
Peavey Onstad Lenee
Purchase Details
Closed on
Jun 27, 2008
Sold by
Langford Sam W and Langford Kari J
Bought by
Peavey Onstad Lenae
Purchase Details
Closed on
Jul 6, 2007
Sold by
Langford Sam and Langford Kari
Bought by
Langford Sam W and Langford Kari J
Purchase Details
Closed on
Jun 6, 2000
Sold by
Bunting Stephen R and Bunting Valerie H
Bought by
Langford Sam and Langford Kari
Create a Home Valuation Report for This Property
The Home Valuation Report is an in-depth analysis detailing your home's value as well as a comparison with similar homes in the area
Home Values in the Area
Average Home Value in this Area
Purchase History
| Date | Buyer | Sale Price | Title Company |
|---|---|---|---|
| Sfr Acquisitions 1 Llc | -- | Metro National Title | |
| Jolley Taylor | -- | First American Title | |
| Peavey Onstad Lenee | -- | Backman Title Services | |
| Peavey Onstad Lenae | -- | First American Title | |
| Langford Sam W | -- | None Available | |
| Langford Sam | -- | Old Republic Title |
Source: Public Records
Mortgage History
| Date | Status | Borrower | Loan Amount |
|---|---|---|---|
| Previous Owner | Jolley Taylor | $244,000 |
Source: Public Records
Tax History Compared to Growth
Tax History
| Year | Tax Paid | Tax Assessment Tax Assessment Total Assessment is a certain percentage of the fair market value that is determined by local assessors to be the total taxable value of land and additions on the property. | Land | Improvement |
|---|---|---|---|---|
| 2025 | $2,746 | $461,600 | $104,600 | $357,000 |
| 2024 | $2,746 | $450,400 | $92,200 | $358,200 |
| 2023 | $2,746 | $434,900 | $89,000 | $345,900 |
| 2022 | $2,694 | $437,200 | $87,200 | $350,000 |
| 2021 | $1,982 | $280,100 | $70,700 | $209,400 |
| 2020 | $1,853 | $247,800 | $70,700 | $177,100 |
| 2019 | $1,877 | $245,100 | $70,700 | $174,400 |
| 2018 | $1,826 | $225,800 | $67,800 | $158,000 |
| 2017 | $1,504 | $199,000 | $67,800 | $131,200 |
| 2016 | $1,367 | $168,100 | $67,800 | $100,300 |
| 2015 | $1,354 | $167,400 | $80,900 | $86,500 |
| 2014 | $1,298 | $157,600 | $77,100 | $80,500 |
Source: Public Records
Map
Nearby Homes
- 1475 W 4950 S
- 1886 W Champagne Ave
- 1401 Beacon Hill Dr Unit 118
- 1381 Beacon Hill Dr
- 1370 W Telegraph Hill Dr
- 4866 Marianna Dr
- 5449 S Coastal Ct
- 5020 S 1250 W
- 2016 W Hew Wood Ct
- 1380 W Ocean Ct
- 2063 W Chateau Ave
- 5435 S Break Water Dr
- 1332 W Ocean Ct
- 1904 W 4840 S
- 1334 Portside Way Unit 165
- 2104 W Champagne Cir
- 1338 W 4800 S
- 1201 W Marinwood Ave
- 1273 W Brister Dr
- 1186 W Marinwood Ave
- 1605 W Lovely Rd
- 1617 W Lovely Rd
- 1617 Lovely Rd
- 1595 Lovely Rd
- 1612 Jolly Cir
- 1625 Lovely Rd
- 1618 Jolly Cir
- 1598 5095 S
- 1610 W Lovely Rd
- 1606 Jolly Cir
- 1598 Lovely Rd
- 1610 Lovely Rd
- 1628 W Jolly Cir
- 1628 Jolly Cir
- 1624 W Lovely Rd
- 1635 W Lovely Rd
- 1624 Lovely Rd
- 1586 Lovely Rd
- 1635 Lovely Rd
- 1634 Jolly Cir