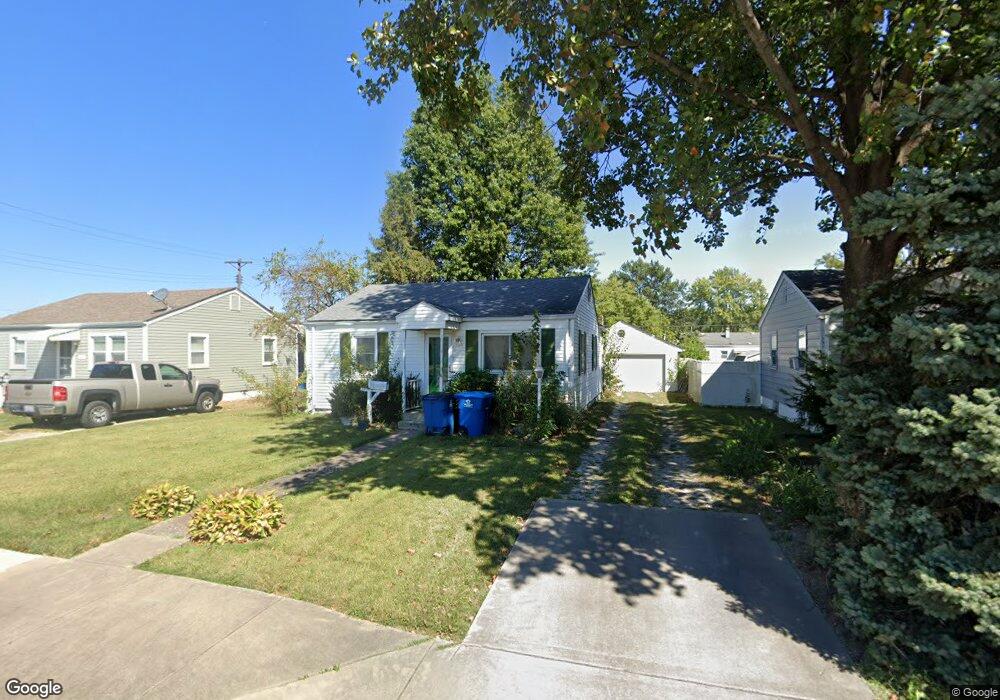
1605 Mitchell Ave Granite City, IL 62040
Estimated Value: $112,319 - $152,000
2
Beds
1
Bath
834
Sq Ft
$151/Sq Ft
Est. Value
About This Home
This home is located at 1605 Mitchell Ave, Granite City, IL 62040 and is currently estimated at $125,830, approximately $150 per square foot. 1605 Mitchell Ave is a home located in Madison County with nearby schools including Granite City High School, St. Elizabeth Elementary School, and Metro East Montessori School.
Ownership History
Date
Name
Owned For
Owner Type
Purchase Details
Closed on
Oct 16, 2017
Sold by
Hall Richard E
Bought by
Hall Tina R
Current Estimated Value
Purchase Details
Closed on
May 9, 2008
Sold by
Smith Justin R
Bought by
Hall Patricia
Purchase Details
Closed on
Sep 20, 2005
Sold by
Balcer Bessie A and Hosto Judith A
Bought by
Smith Justin R
Home Financials for this Owner
Home Financials are based on the most recent Mortgage that was taken out on this home.
Original Mortgage
$64,500
Interest Rate
6.01%
Mortgage Type
Fannie Mae Freddie Mac
Purchase Details
Closed on
Mar 7, 2003
Sold by
Balcer Bessie A
Bought by
Balcer Bessie A
Purchase Details
Closed on
Feb 21, 2003
Sold by
Young Everett D and Young Geraldine
Bought by
Young Keith D and Young Mary A
Create a Home Valuation Report for This Property
The Home Valuation Report is an in-depth analysis detailing your home's value as well as a comparison with similar homes in the area
Home Values in the Area
Average Home Value in this Area
Purchase History
| Date | Buyer | Sale Price | Title Company |
|---|---|---|---|
| Hall Tina R | -- | -- | |
| Hall Patricia | $67,000 | Pontoon Title Co | |
| Smith Justin R | $64,500 | Metro Title & Escrow Company | |
| Balcer Bessie A | -- | Metro Title & Escrow Company | |
| Balcer Bessie | $53,000 | Metro Title & Escrow Company | |
| Young Keith D | -- | Metro Title & Escrow Company |
Source: Public Records
Mortgage History
| Date | Status | Borrower | Loan Amount |
|---|---|---|---|
| Previous Owner | Smith Justin R | $64,500 |
Source: Public Records
Tax History Compared to Growth
Tax History
| Year | Tax Paid | Tax Assessment Tax Assessment Total Assessment is a certain percentage of the fair market value that is determined by local assessors to be the total taxable value of land and additions on the property. | Land | Improvement |
|---|---|---|---|---|
| 2024 | $2,676 | $30,700 | $3,590 | $27,110 |
| 2023 | $2,676 | $27,670 | $3,240 | $24,430 |
| 2022 | $2,635 | $25,350 | $2,970 | $22,380 |
| 2021 | $2,460 | $23,780 | $2,790 | $20,990 |
| 2020 | $2,402 | $22,710 | $2,660 | $20,050 |
| 2019 | $2,332 | $21,520 | $2,520 | $19,000 |
| 2018 | $2,276 | $20,890 | $2,450 | $18,440 |
| 2017 | $1,592 | $21,660 | $2,540 | $19,120 |
| 2016 | $1,646 | $21,660 | $2,540 | $19,120 |
| 2015 | $1,484 | $21,660 | $2,540 | $19,120 |
| 2014 | $1,484 | $21,660 | $2,540 | $19,120 |
| 2013 | $1,484 | $21,660 | $2,540 | $19,120 |
Source: Public Records
Map
Nearby Homes
- 1612 Mitchell Ave
- 1612 Venice Ave
- 3805 Fair Oaks Dr
- 1737 Moro Ave
- 4023 Braden Ave
- 4104 Braden Ave
- 50 Janday Ln
- 1517 Garfield Ave
- 1728 Ferguson Ave
- 213 Briarwood Dr
- 1511 Cottage Ave
- 1732 Sycamore St
- 1633 Sycamore St
- 2125 Lynch Ave
- 3424 Lydia Ln
- 2125 Woodlawn Ave
- 2132 Orville Ave
- 440 Wilson Park Ln
- 3365 Colgate Place
- 1608 Union Ave
- 1609 Mitchell Ave
- 1601 Mitchell Ave
- 1613 Mitchell Ave
- 1616 Moro Ave
- 1620 Moro Ave
- 1612 Moro Ave
- 1624 Moro Ave
- 1617 Mitchell Ave
- 1604 Mitchell Ave
- 1628 Moro Ave
- 1621 Mitchell Ave
- 1632 Moro Ave
- 1608 Mitchell Ave
- 1625 Mitchell Ave
- 1636 Moro Ave
- 1629 Mitchell Ave
- 1617 Moro Ave
- 1613 Moro Ave
- 1621 Moro Ave
- 1625 Moro Ave