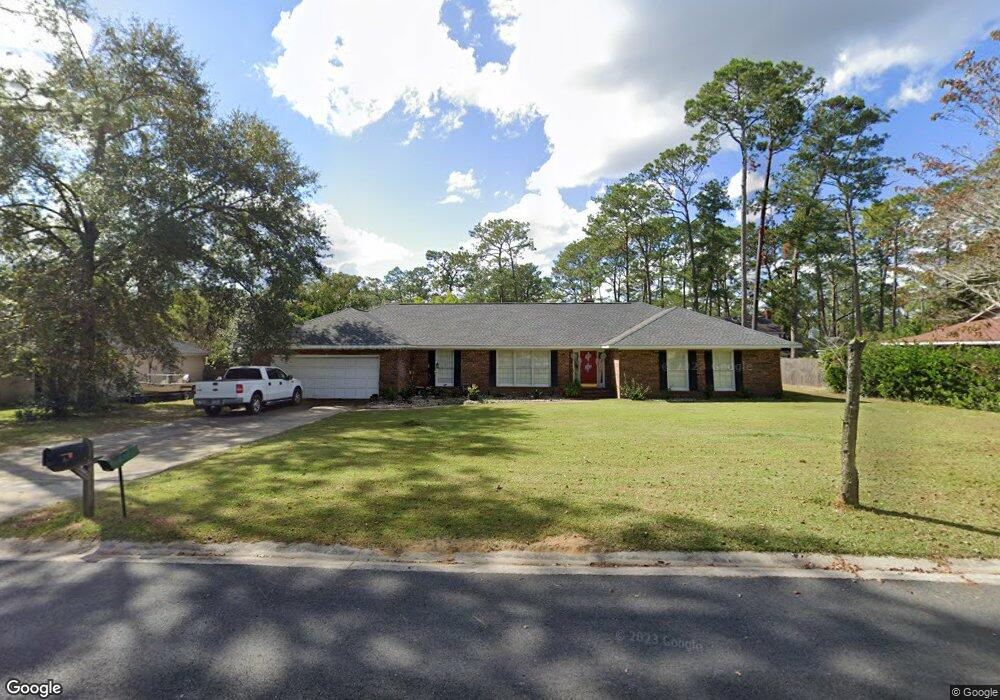
1605 Moss Creek Rd Waycross, GA 31501
Estimated Value: $312,520 - $347,000
4
Beds
3
Baths
2,611
Sq Ft
$126/Sq Ft
Est. Value
About This Home
This home is located at 1605 Moss Creek Rd, Waycross, GA 31501 and is currently estimated at $328,380, approximately $125 per square foot. 1605 Moss Creek Rd is a home located in Ware County with nearby schools including Center Elementary School, Waycross Middle School, and Ware County High School.
Ownership History
Date
Name
Owned For
Owner Type
Purchase Details
Closed on
Sep 8, 2016
Sold by
Vincent T Vernelle
Bought by
Fales Daniel and Fales Jennifer
Current Estimated Value
Home Financials for this Owner
Home Financials are based on the most recent Mortgage that was taken out on this home.
Original Mortgage
$175,610
Outstanding Balance
$140,361
Interest Rate
3.45%
Mortgage Type
VA
Estimated Equity
$188,019
Purchase Details
Closed on
Oct 27, 2000
Sold by
Wright Shirley and Wright Che
Bought by
Carter Kenneth L and Carter Tammy M
Purchase Details
Closed on
Nov 25, 1998
Sold by
Relocation Resources
Bought by
Wright Shirley and Wright Che
Purchase Details
Closed on
Jul 5, 1998
Sold by
Orr Lee H and Orr Barbara
Bought by
Relocation Resources
Purchase Details
Closed on
Dec 8, 1995
Bought by
Orr Lee H and Orr Barbara
Purchase Details
Closed on
Jun 29, 1994
Bought by
Mobley David A and Mobley Pat
Create a Home Valuation Report for This Property
The Home Valuation Report is an in-depth analysis detailing your home's value as well as a comparison with similar homes in the area
Home Values in the Area
Average Home Value in this Area
Purchase History
| Date | Buyer | Sale Price | Title Company |
|---|---|---|---|
| Fales Daniel | $170,000 | -- | |
| Carter Kenneth L | $138,000 | -- | |
| Wright Shirley | $132,500 | -- | |
| Relocation Resources | $142,500 | -- | |
| Orr Lee H | $130,000 | -- | |
| Mobley David A | $126,000 | -- |
Source: Public Records
Mortgage History
| Date | Status | Borrower | Loan Amount |
|---|---|---|---|
| Open | Fales Daniel | $175,610 |
Source: Public Records
Tax History Compared to Growth
Tax History
| Year | Tax Paid | Tax Assessment Tax Assessment Total Assessment is a certain percentage of the fair market value that is determined by local assessors to be the total taxable value of land and additions on the property. | Land | Improvement |
|---|---|---|---|---|
| 2024 | $1,648 | $126,280 | $4,800 | $121,480 |
| 2023 | $1,681 | $88,880 | $4,736 | $84,144 |
| 2022 | $1,873 | $88,880 | $4,736 | $84,144 |
| 2021 | $1,985 | $73,582 | $4,736 | $68,846 |
| 2020 | $2,006 | $73,582 | $4,736 | $68,846 |
| 2019 | $2,046 | $69,016 | $4,736 | $64,280 |
| 2018 | $2,113 | $66,732 | $4,736 | $61,996 |
| 2017 | $1,944 | $66,732 | $4,736 | $61,996 |
| 2016 | $1,944 | $66,732 | $4,736 | $61,996 |
| 2015 | $1,959 | $66,732 | $4,736 | $61,996 |
| 2014 | $2,051 | $66,732 | $4,736 | $61,996 |
| 2013 | -- | $66,732 | $4,736 | $61,996 |
Source: Public Records
Map
Nearby Homes
- 1504 Danora Dr
- 1617 Moss Creek Rd
- 1502 Seminole Trail
- 1622 Booth St
- 1621 Camellia Dr
- 1400 E Cherokee Dr
- 1703 Rainbow Dr
- 00 Seminole Trail
- 1206 Morningside Dr
- Lot 3 City Blvd
- 914 Barkley St
- 1312 Atlantic Ave
- 1715 City Blvd
- 1103 Kontz Ave
- 1204 Richmond Ave
- 1100 Euclid Ave
- 1002 Baltimore Ave
- 1011 Cherokee Cir
- 1009 Euclid Ave
- 1002 Cherokee Cir
- 1607 Moss Creek Rd
- 1603 Moss Creek Rd
- 1606 Moss Creek Rd
- 1700 Danora Dr
- 1604 Danora Dr
- 1608 Moss Creek Rd
- 1604 Moss Creek Rd
- 1609 Moss Creek Rd
- 1601 Moss Creek Rd
- 1610 Moss Creek Rd
- 1600 Danora Dr
- 1605 Booth St
- 1702 Danora Dr
- 1602 Moss Creek Rd
- 1607 Booth St
- 1603 Booth St
- 1611 Moss Creek Rd
- 1612 Moss Creek Rd
- 1609 Booth St
- 1608 E Cherokee Dr