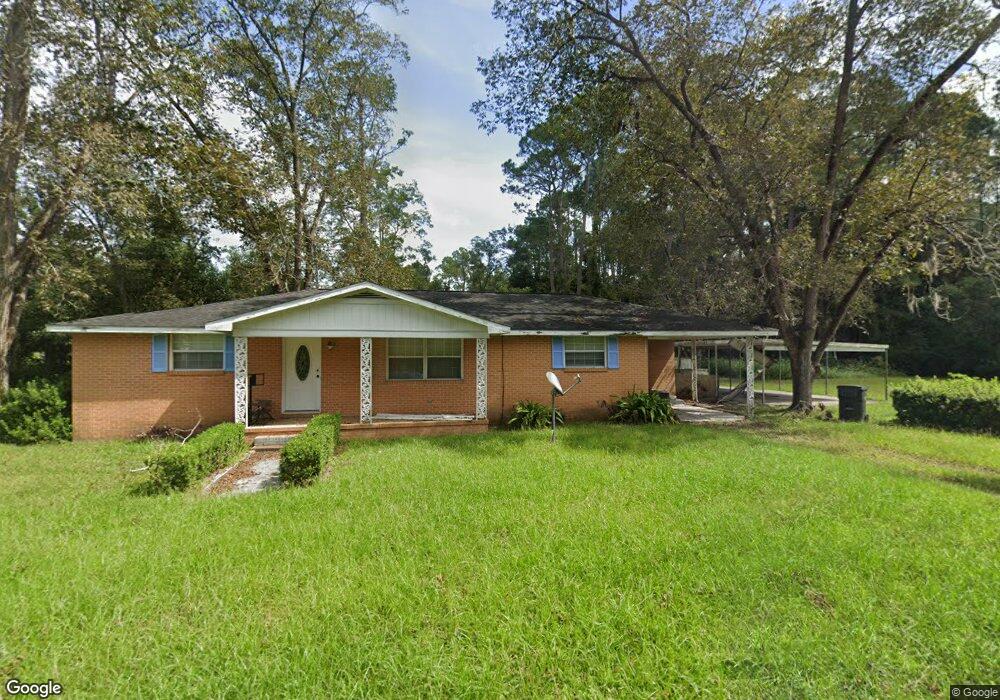
1605 Osceola Ave Waycross, GA 31503
Estimated Value: $103,000 - $145,000
3
Beds
2
Baths
1,500
Sq Ft
$82/Sq Ft
Est. Value
About This Home
This home is located at 1605 Osceola Ave, Waycross, GA 31503 and is currently estimated at $122,281, approximately $81 per square foot. 1605 Osceola Ave is a home located in Ware County with nearby schools including Memorial Drive Elementary School, Waycross Middle School, and Ware County High School.
Ownership History
Date
Name
Owned For
Owner Type
Purchase Details
Closed on
Feb 14, 2025
Sold by
Roberts Shawn L
Bought by
Roberts Javier A and Roberts Shawn L
Current Estimated Value
Purchase Details
Closed on
Apr 27, 2021
Sold by
Roberts Isaac O
Bought by
Roberts Shawn L
Purchase Details
Closed on
Dec 9, 2007
Sold by
Roberts Shawn L
Bought by
Roberts Isaac O
Purchase Details
Closed on
Oct 12, 2005
Sold by
Amc Mtg Svcs
Bought by
Roberts Shawn L
Home Financials for this Owner
Home Financials are based on the most recent Mortgage that was taken out on this home.
Original Mortgage
$45,466
Interest Rate
5.84%
Mortgage Type
New Conventional
Purchase Details
Closed on
Aug 2, 2005
Sold by
Cartwright Patrick D
Bought by
Ameriquest Mtg Co
Purchase Details
Closed on
Jan 28, 2000
Sold by
Reynolds Mamie
Bought by
Cartwright Patrick
Create a Home Valuation Report for This Property
The Home Valuation Report is an in-depth analysis detailing your home's value as well as a comparison with similar homes in the area
Home Values in the Area
Average Home Value in this Area
Purchase History
| Date | Buyer | Sale Price | Title Company |
|---|---|---|---|
| Roberts Javier A | -- | -- | |
| Roberts Shawn L | -- | -- | |
| Roberts Isaac O | -- | -- | |
| Roberts Shawn L | $27,000 | -- | |
| Ameriquest Mtg Co | -- | -- | |
| Cartwright Patrick | $45,000 | -- |
Source: Public Records
Mortgage History
| Date | Status | Borrower | Loan Amount |
|---|---|---|---|
| Previous Owner | Roberts Shawn L | $45,466 |
Source: Public Records
Tax History Compared to Growth
Tax History
| Year | Tax Paid | Tax Assessment Tax Assessment Total Assessment is a certain percentage of the fair market value that is determined by local assessors to be the total taxable value of land and additions on the property. | Land | Improvement |
|---|---|---|---|---|
| 2024 | $1,312 | $44,609 | $2,508 | $42,101 |
| 2023 | $1,538 | $36,794 | $3,174 | $33,620 |
| 2022 | $1,466 | $36,794 | $3,174 | $33,620 |
| 2021 | $1,247 | $28,831 | $3,174 | $25,657 |
| 2020 | $1,239 | $28,420 | $3,174 | $25,246 |
| 2019 | $1,184 | $26,778 | $3,174 | $23,604 |
| 2018 | $1,149 | $25,752 | $3,174 | $22,578 |
| 2017 | $1,123 | $25,752 | $3,174 | $22,578 |
| 2016 | $1,123 | $25,752 | $3,174 | $22,578 |
| 2015 | $1,131 | $25,751 | $3,174 | $22,578 |
| 2014 | $1,130 | $25,751 | $3,174 | $22,578 |
| 2013 | -- | $25,751 | $3,173 | $22,577 |
Source: Public Records
Map
Nearby Homes
- 208 E Hamilton Ave
- 108 E Hamilton Ave
- 207 E Hamilton Ave
- 1604 Osceola Ave
- 109 E Hamilton Ave
- 1615 Osceola Ave
- 211 E Hamilton Ave
- 1507 Gilmore St
- 1503 Gilmore St
- 1610 Osceola Ave
- 1603 Gilmore St
- 1501 Gilmore St
- 1605 Gilmore St
- 1607 Gilmore St
- 1425 Gilmore St
- 1423 Gilmore St
- 1609 Gilmore St
- 107 Lewis St
- 1613 Gilmore St
- 302 E Hamilton Ave