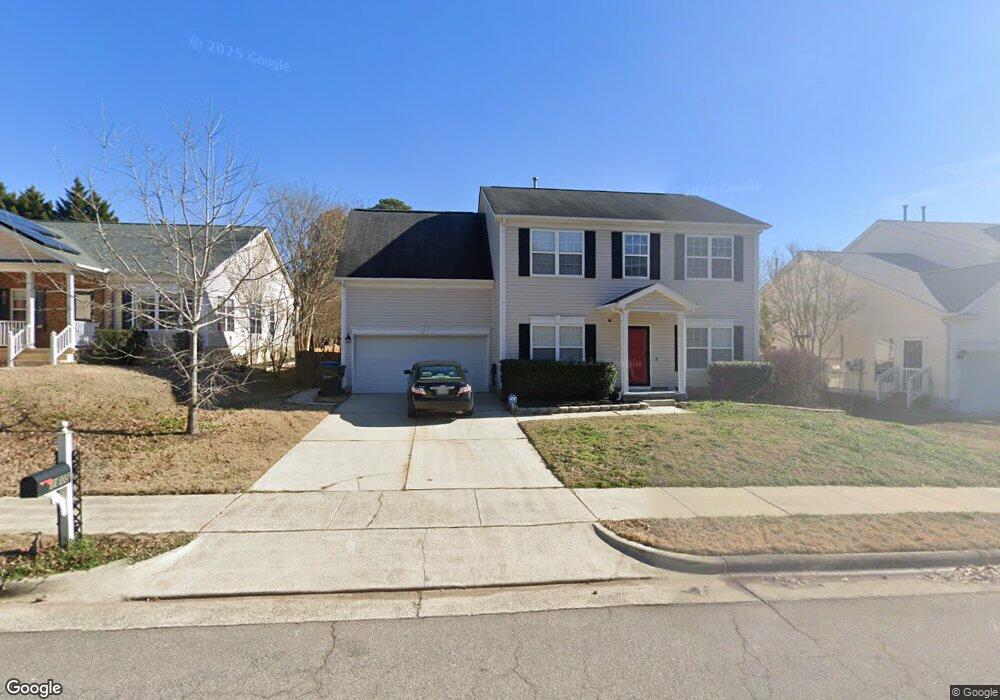
1605 Piperwood Ct Durham, NC 27713
Estimated Value: $491,000 - $512,000
4
Beds
3
Baths
2,178
Sq Ft
$231/Sq Ft
Est. Value
About This Home
This home is located at 1605 Piperwood Ct, Durham, NC 27713 and is currently estimated at $503,022, approximately $230 per square foot. 1605 Piperwood Ct is a home located in Durham County with nearby schools including Parkwood Elementary, Centerville Junior High School, and Lowe's Grove Middle.
Ownership History
Date
Name
Owned For
Owner Type
Purchase Details
Closed on
Nov 26, 2019
Sold by
Boushell Lee W and Boushell Sheryl A
Bought by
Curle Karen M
Current Estimated Value
Home Financials for this Owner
Home Financials are based on the most recent Mortgage that was taken out on this home.
Original Mortgage
$237,600
Outstanding Balance
$209,065
Interest Rate
3.5%
Mortgage Type
New Conventional
Estimated Equity
$293,957
Purchase Details
Closed on
Jan 28, 2005
Sold by
Ziauddin Shareef and Kahakashan Rahamat
Bought by
Boushell Lee W and Boushell Sheryl A
Home Financials for this Owner
Home Financials are based on the most recent Mortgage that was taken out on this home.
Original Mortgage
$152,800
Interest Rate
5.69%
Mortgage Type
Purchase Money Mortgage
Purchase Details
Closed on
Feb 28, 2002
Sold by
Beazer Homes Corp
Bought by
Ziauddin Shareef and Kahakashan Rahamat
Home Financials for this Owner
Home Financials are based on the most recent Mortgage that was taken out on this home.
Original Mortgage
$156,800
Interest Rate
6.81%
Create a Home Valuation Report for This Property
The Home Valuation Report is an in-depth analysis detailing your home's value as well as a comparison with similar homes in the area
Home Values in the Area
Average Home Value in this Area
Purchase History
| Date | Buyer | Sale Price | Title Company |
|---|---|---|---|
| Curle Karen M | $297,000 | None Available | |
| Boushell Lee W | $191,000 | -- | |
| Ziauddin Shareef | $165,500 | -- |
Source: Public Records
Mortgage History
| Date | Status | Borrower | Loan Amount |
|---|---|---|---|
| Open | Curle Karen M | $237,600 | |
| Previous Owner | Boushell Lee W | $152,800 | |
| Previous Owner | Ziauddin Shareef | $156,800 |
Source: Public Records
Tax History Compared to Growth
Tax History
| Year | Tax Paid | Tax Assessment Tax Assessment Total Assessment is a certain percentage of the fair market value that is determined by local assessors to be the total taxable value of land and additions on the property. | Land | Improvement |
|---|---|---|---|---|
| 2025 | $4,683 | $472,429 | $117,000 | $355,429 |
| 2024 | $3,912 | $280,436 | $58,650 | $221,786 |
| 2023 | $3,673 | $280,436 | $58,650 | $221,786 |
| 2022 | $3,589 | $280,436 | $58,650 | $221,786 |
| 2021 | $3,572 | $280,436 | $58,650 | $221,786 |
| 2020 | $3,488 | $280,436 | $58,650 | $221,786 |
| 2019 | $3,488 | $280,436 | $58,650 | $221,786 |
| 2018 | $3,337 | $245,965 | $35,190 | $210,775 |
| 2017 | $3,312 | $245,965 | $35,190 | $210,775 |
| 2016 | $3,200 | $245,965 | $35,190 | $210,775 |
| 2015 | $3,199 | $231,089 | $35,206 | $195,883 |
| 2014 | $3,199 | $231,089 | $35,206 | $195,883 |
Source: Public Records
Map
Nearby Homes
- 1510 Haventree Rd
- 104 Deblyn Ct
- 1445 Sedwick Rd
- 5320 Newhall Rd
- 5504 Pelham Rd
- 6353 Grandale Dr
- 1621 Clermont Rd
- 1304 Seaton Rd Unit 1
- 1304 Seaton Rd Unit 17
- 1304 Seaton Rd Unit 24
- 704 Colby Place
- 5916 Lyon Farm Dr
- 1227 Seaton Rd Unit 54
- 109 Settlers Mill Ln
- 27 Sunflower Ct
- 1728 Euclid Rd
- 1018 Fenwick Pkwy
- 7409 Chesley Ln
- 313 Bennington Pkwy
- 9 Monteith Ct
- 1603 Piperwood Ct
- 1607 Piperwood Ct
- 3 Wood Duck Ct
- 1601 Piperwood Ct
- 4 Weeping Beech Way
- 6 Weeping Beech Way
- 1701 Piperwood Ct
- 5 Wood Duck Ct
- 1606 Piperwood Ct
- 1602 Piperwood Ct
- 7 Wood Duck Ct
- 1513 Piperwood Ct
- 4 Wood Duck Ct
- 1703 Piperwood Ct
- 9 Wood Duck Ct
- 3 Weeping Beech Way
- 10 Weeping Beech Way
- 1702 Piperwood Ct
- 1511 Piperwood Ct
- 5 Weeping Beech Way