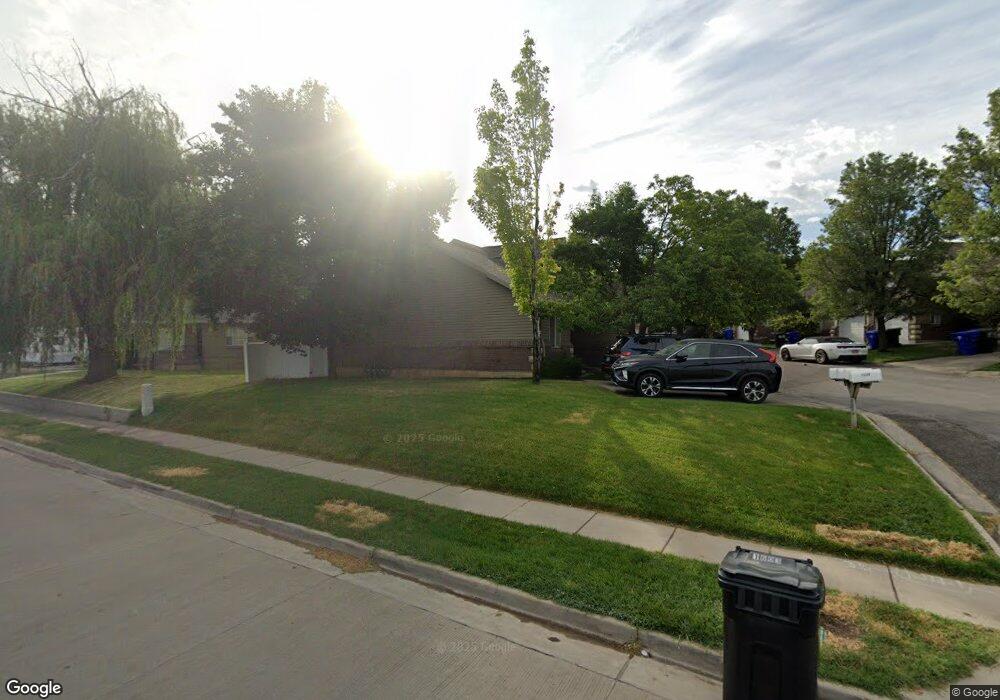
1605 S Main St Bountiful, UT 84010
Estimated Value: $380,418 - $445,000
4
Beds
3
Baths
2,196
Sq Ft
$190/Sq Ft
Est. Value
About This Home
This home is located at 1605 S Main St, Bountiful, UT 84010 and is currently estimated at $416,855, approximately $189 per square foot. 1605 S Main St is a home located in Davis County with nearby schools including Bountiful Elementary School, Mueller Park Junior High School, and Bountiful High School.
Ownership History
Date
Name
Owned For
Owner Type
Purchase Details
Closed on
Dec 12, 2003
Sold by
Henderson Mark R and Henderson Jeanene M
Bought by
Jensen Brian
Current Estimated Value
Home Financials for this Owner
Home Financials are based on the most recent Mortgage that was taken out on this home.
Original Mortgage
$90,000
Interest Rate
5.26%
Mortgage Type
Purchase Money Mortgage
Purchase Details
Closed on
Aug 23, 2000
Sold by
Henderson Lori
Bought by
Henderson Mark R and Henderson Jeanene M
Purchase Details
Closed on
Dec 1, 1999
Sold by
Henderson Mark R
Bought by
Henderson Lori
Home Financials for this Owner
Home Financials are based on the most recent Mortgage that was taken out on this home.
Original Mortgage
$139,409
Interest Rate
7.95%
Mortgage Type
Seller Take Back
Purchase Details
Closed on
Sep 9, 1997
Sold by
S K Enterprises Lc
Bought by
Henderson Mark E
Create a Home Valuation Report for This Property
The Home Valuation Report is an in-depth analysis detailing your home's value as well as a comparison with similar homes in the area
Purchase History
| Date | Buyer | Sale Price | Title Company |
|---|---|---|---|
| Jensen Brian | -- | Twtc | |
| Henderson Mark R | -- | Equity Title Agency | |
| Henderson Lori | -- | Equity Title Agency | |
| Henderson Mark E | -- | Equity Title Agency |
Source: Public Records
Mortgage History
| Date | Status | Borrower | Loan Amount |
|---|---|---|---|
| Closed | Jensen Brian | $90,000 | |
| Previous Owner | Henderson Lori | $139,409 |
Source: Public Records
Tax History
| Year | Tax Paid | Tax Assessment Tax Assessment Total Assessment is a certain percentage of the fair market value that is determined by local assessors to be the total taxable value of land and additions on the property. | Land | Improvement |
|---|---|---|---|---|
| 2025 | $2,191 | $188,650 | $48,950 | $139,700 |
| 2024 | $2,178 | $182,600 | $54,450 | $128,150 |
| 2023 | $2,174 | $331,000 | $93,000 | $238,000 |
| 2022 | $2,163 | $184,800 | $32,450 | $152,350 |
| 2021 | $1,927 | $248,000 | $46,000 | $202,000 |
| 2020 | $1,800 | $227,000 | $42,600 | $184,400 |
| 2019 | $1,579 | $214,000 | $39,000 | $175,000 |
| 2018 | $1,411 | $191,000 | $36,000 | $155,000 |
| 2016 | $1,303 | $91,025 | $17,600 | $73,425 |
| 2015 | $1,065 | $76,340 | $17,600 | $58,740 |
| 2014 | $1,186 | $87,989 | $18,333 | $69,656 |
| 2013 | -- | $80,644 | $14,850 | $65,794 |
Source: Public Records
Map
Nearby Homes
Your Personal Tour Guide
Ask me questions while you tour the home.