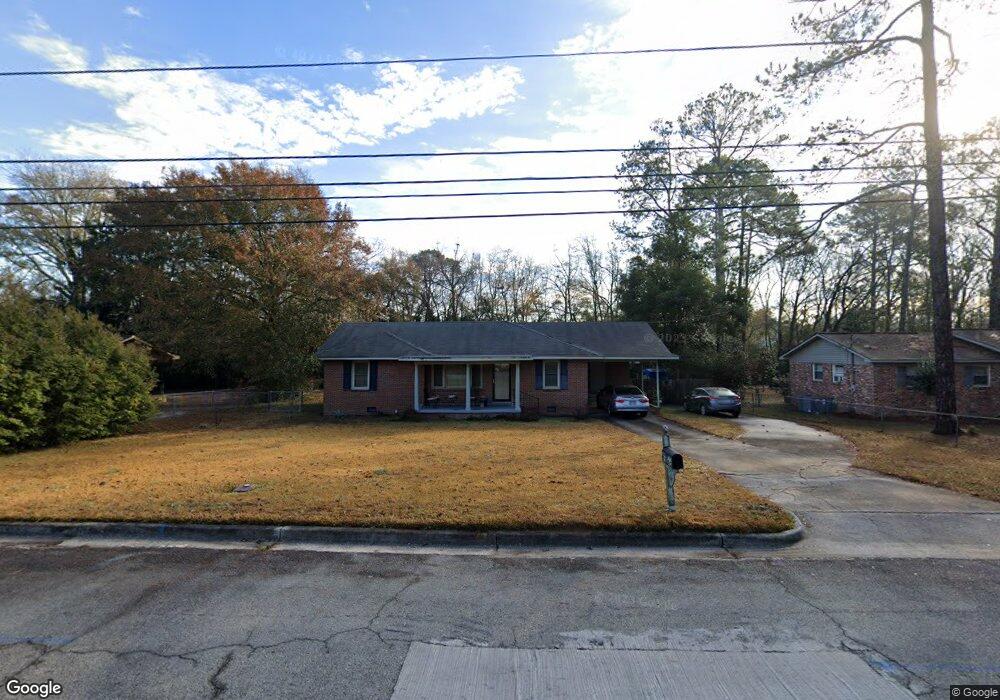
1605 Tyson Ave Tifton, GA 31794
Estimated Value: $159,913 - $211,000
3
Beds
2
Baths
1,769
Sq Ft
$108/Sq Ft
Est. Value
About This Home
This home is located at 1605 Tyson Ave, Tifton, GA 31794 and is currently estimated at $191,228, approximately $108 per square foot. 1605 Tyson Ave is a home located in Tift County with nearby schools including Northside Primary School, Charles Spencer Elementary School, and J.T. Reddick School.
Ownership History
Date
Name
Owned For
Owner Type
Purchase Details
Closed on
Jan 18, 2023
Sold by
Williams Billy Bob
Bought by
Williams Linda B
Current Estimated Value
Home Financials for this Owner
Home Financials are based on the most recent Mortgage that was taken out on this home.
Original Mortgage
$32,000
Outstanding Balance
$29,671
Interest Rate
6.27%
Mortgage Type
New Conventional
Estimated Equity
$161,558
Purchase Details
Closed on
May 6, 2022
Sold by
Harbin Laura Ann
Bought by
Williams Linda B and Williams Billy B
Purchase Details
Closed on
Nov 14, 2019
Sold by
Hardin Laura Ann
Bought by
Williams Linda B
Purchase Details
Closed on
Mar 24, 2011
Sold by
Willis Joyce Y
Bought by
Hardin Laura Ann
Purchase Details
Closed on
Jan 16, 1986
Sold by
Hutchinson Linda W
Bought by
Berry Joyce Y
Purchase Details
Closed on
Jan 4, 1985
Sold by
Hutchinson Bobby G
Bought by
Hutchinson Linda W
Purchase Details
Closed on
Apr 4, 1973
Sold by
Connell J O
Bought by
Hutchinson Bobby G and Hutchinson Linda W
Create a Home Valuation Report for This Property
The Home Valuation Report is an in-depth analysis detailing your home's value as well as a comparison with similar homes in the area
Home Values in the Area
Average Home Value in this Area
Purchase History
| Date | Buyer | Sale Price | Title Company |
|---|---|---|---|
| Williams Linda B | $32,000 | -- | |
| Williams Linda B | $32,000 | -- | |
| Williams Linda B | -- | -- | |
| Hardin Laura Ann | -- | -- | |
| Berry Joyce Y | $45,500 | -- | |
| Hutchinson Linda W | -- | -- | |
| Hutchinson Bobby G | $16,500 | -- |
Source: Public Records
Mortgage History
| Date | Status | Borrower | Loan Amount |
|---|---|---|---|
| Open | Williams Linda B | $32,000 |
Source: Public Records
Tax History Compared to Growth
Tax History
| Year | Tax Paid | Tax Assessment Tax Assessment Total Assessment is a certain percentage of the fair market value that is determined by local assessors to be the total taxable value of land and additions on the property. | Land | Improvement |
|---|---|---|---|---|
| 2024 | $1,264 | $60,804 | $3,220 | $57,584 |
| 2023 | $1,351 | $36,668 | $4,000 | $32,668 |
| 2022 | $1,380 | $36,668 | $4,000 | $32,668 |
| 2021 | $1,389 | $36,668 | $4,000 | $32,668 |
| 2020 | $1,423 | $36,668 | $4,000 | $32,668 |
| 2019 | $1,424 | $36,668 | $4,000 | $32,668 |
| 2018 | $1,424 | $36,668 | $4,000 | $32,668 |
| 2017 | $1,461 | $36,668 | $4,000 | $32,668 |
| 2016 | $1,463 | $36,668 | $4,000 | $32,668 |
| 2015 | $1,465 | $36,668 | $4,000 | $32,668 |
| 2014 | $1,467 | $36,668 | $4,000 | $32,668 |
| 2013 | -- | $36,668 | $4,000 | $32,668 |
Source: Public Records
Map
Nearby Homes
- 1809 Davis Ave
- 705 20th St E
- 2021 Davis Ave
- 2020 Davis Ave
- 502 20th St E
- 0 Old Ocilla Rd Unit 138781
- 0 Old Ocilla Rd Unit 10611000
- 1430 Madison Ave
- 2417 Belmont Ave
- 1137 Oquinn Dr
- 0 Tift Ave
- -0- Old Ocilla Rd
- 1611 Love Ave
- 219 Cypress Ridge Rd
- 2612 Goff St
- 0 Central Ave Unit 138182
- 0 Central Ave Unit 137897
- 0 Central Ave Unit 137896
- 0 Central Ave Unit 137898
- 0 Central Ave Unit 137895
- 1601 Tyson Ave
- 1607 Tyson Ave
- 1619 Tyson Ave
- 1600 Tyson Ave
- 1608 Tyson Ave
- 1614 Tyson Ave
- 1616 Tyson Ave
- 617 16th St E
- 624 16th St E
- 1801 Tyson Ave
- 1603 Belmont Ave
- 616 18th St E
- 1611 Belmont Ave
- 1601 Belmont Ave
- 618 16th St E
- 1802 Tyson Ave
- 1805 Tyson Ave
- 1617 Belmont Ave
- 616 16th St E
- 1804 Tyson Ave