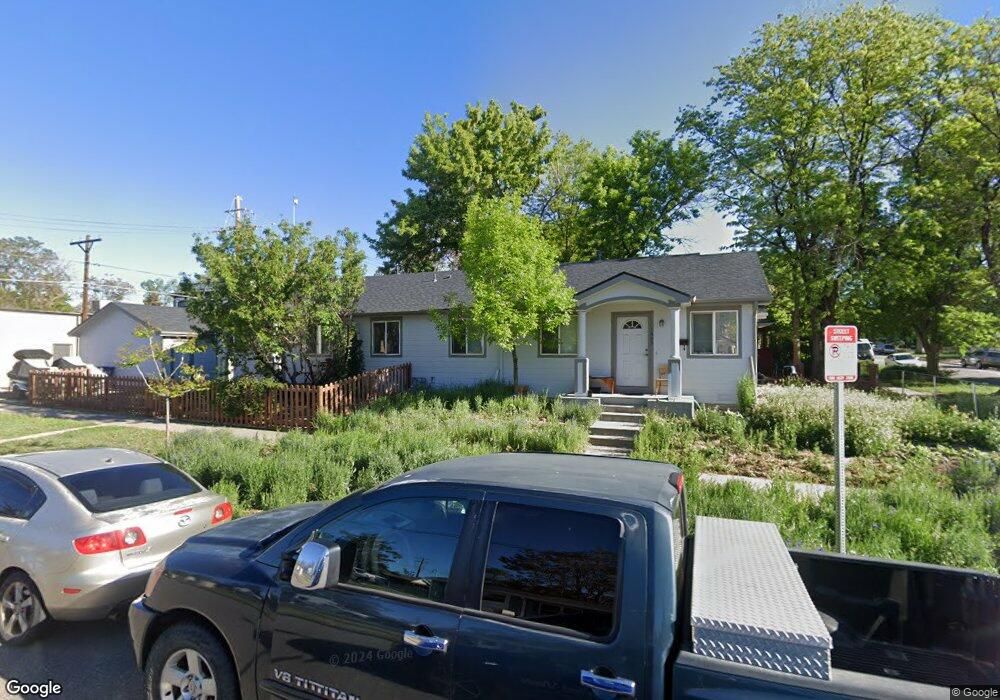
1605 W 39th Ave Denver, CO 80211
Sunnyside NeighborhoodEstimated Value: $524,000 - $595,000
2
Beds
2
Baths
1,065
Sq Ft
$528/Sq Ft
Est. Value
About This Home
This home is located at 1605 W 39th Ave, Denver, CO 80211 and is currently estimated at $562,054, approximately $527 per square foot. 1605 W 39th Ave is a home located in Denver County with nearby schools including Bryant Webster Dual Language School, Denver Montessori Junior/Senior High School, and Skinner Middle School.
Ownership History
Date
Name
Owned For
Owner Type
Purchase Details
Closed on
Jan 30, 2002
Sold by
Jones Samuel L
Bought by
Gutierrez Alfonso
Current Estimated Value
Home Financials for this Owner
Home Financials are based on the most recent Mortgage that was taken out on this home.
Original Mortgage
$159,250
Outstanding Balance
$66,267
Interest Rate
7.15%
Mortgage Type
FHA
Estimated Equity
$495,787
Create a Home Valuation Report for This Property
The Home Valuation Report is an in-depth analysis detailing your home's value as well as a comparison with similar homes in the area
Home Values in the Area
Average Home Value in this Area
Purchase History
| Date | Buyer | Sale Price | Title Company |
|---|---|---|---|
| Gutierrez Alfonso | $161,500 | -- |
Source: Public Records
Mortgage History
| Date | Status | Borrower | Loan Amount |
|---|---|---|---|
| Open | Gutierrez Alfonso | $159,250 | |
| Closed | Gutierrez Alfonso | $5,000 |
Source: Public Records
Tax History Compared to Growth
Tax History
| Year | Tax Paid | Tax Assessment Tax Assessment Total Assessment is a certain percentage of the fair market value that is determined by local assessors to be the total taxable value of land and additions on the property. | Land | Improvement |
|---|---|---|---|---|
| 2024 | $2,595 | $32,760 | $12,290 | $20,470 |
| 2023 | $2,538 | $32,760 | $12,290 | $20,470 |
| 2022 | $2,442 | $30,710 | $14,090 | $16,620 |
| 2021 | $2,357 | $31,590 | $14,490 | $17,100 |
| 2020 | $1,863 | $25,110 | $11,930 | $13,180 |
| 2019 | $1,811 | $25,110 | $11,930 | $13,180 |
| 2018 | $1,738 | $22,460 | $10,540 | $11,920 |
| 2017 | $1,732 | $22,460 | $10,540 | $11,920 |
| 2016 | $1,777 | $21,790 | $7,602 | $14,188 |
| 2015 | $1,702 | $21,790 | $7,602 | $14,188 |
| 2014 | $1,682 | $20,250 | $1,902 | $18,348 |
Source: Public Records
Map
Nearby Homes