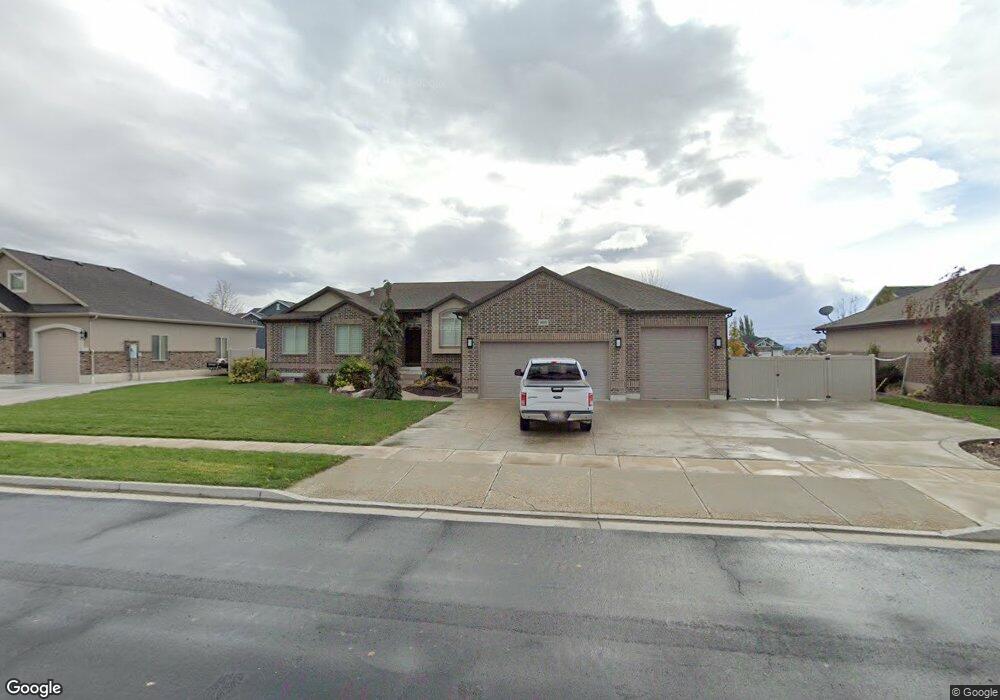
1605 W 600 S Unit 248 Layton, UT 84041
Estimated Value: $684,000 - $796,000
3
Beds
3
Baths
1,789
Sq Ft
$405/Sq Ft
Est. Value
About This Home
This home is located at 1605 W 600 S Unit 248, Layton, UT 84041 and is currently estimated at $725,177, approximately $405 per square foot. 1605 W 600 S Unit 248 is a home located in Davis County with nearby schools including Shoreline Junior High School, Layton High School, and North Davis Preparatory Academy.
Ownership History
Date
Name
Owned For
Owner Type
Purchase Details
Closed on
Nov 6, 2019
Sold by
Ortiz Geroge and Ortiz Rebecka
Bought by
Burk Brandon J
Current Estimated Value
Home Financials for this Owner
Home Financials are based on the most recent Mortgage that was taken out on this home.
Original Mortgage
$352,800
Outstanding Balance
$309,700
Interest Rate
3.6%
Mortgage Type
New Conventional
Estimated Equity
$415,477
Purchase Details
Closed on
Mar 26, 2012
Sold by
Litanski Lori
Bought by
Parsons John R and Parsons Aleesa M
Home Financials for this Owner
Home Financials are based on the most recent Mortgage that was taken out on this home.
Original Mortgage
$266,000
Interest Rate
3.83%
Mortgage Type
New Conventional
Purchase Details
Closed on
Sep 29, 2008
Sold by
Whiterock Homes Inc
Bought by
Litanski Lori
Purchase Details
Closed on
Sep 7, 2007
Sold by
Northland Properties Lc
Bought by
Whiterock Homes Inc
Create a Home Valuation Report for This Property
The Home Valuation Report is an in-depth analysis detailing your home's value as well as a comparison with similar homes in the area
Home Values in the Area
Average Home Value in this Area
Purchase History
| Date | Buyer | Sale Price | Title Company |
|---|---|---|---|
| Burk Brandon J | -- | Inwest Title Services | |
| Burk Brandon J | -- | Inwest Title Services | |
| Parsons John R | -- | Mountain View Title | |
| Parsons John R | -- | Mountain View Title | |
| Litanski Lori | -- | Mountain View Title & Escrow | |
| Litanski Lori | -- | Mountain View Title & Escrow | |
| Whiterock Homes Inc | -- | Heritage West Title Ins Agen | |
| Whiterock Homes Inc | -- | Heritage West Title Ins Agen |
Source: Public Records
Mortgage History
| Date | Status | Borrower | Loan Amount |
|---|---|---|---|
| Open | Burk Brandon J | $352,800 | |
| Previous Owner | Parsons John R | $266,000 |
Source: Public Records
Tax History Compared to Growth
Tax History
| Year | Tax Paid | Tax Assessment Tax Assessment Total Assessment is a certain percentage of the fair market value that is determined by local assessors to be the total taxable value of land and additions on the property. | Land | Improvement |
|---|---|---|---|---|
| 2025 | $3,416 | $358,601 | $137,055 | $221,546 |
| 2024 | $3,209 | $339,350 | $145,704 | $193,646 |
| 2023 | $3,284 | $612,000 | $156,235 | $455,765 |
| 2022 | $3,500 | $354,200 | $89,596 | $264,604 |
| 2021 | $3,067 | $463,000 | $134,364 | $328,636 |
| 2020 | $2,873 | $416,000 | $115,175 | $300,825 |
| 2019 | $2,806 | $398,000 | $112,946 | $285,054 |
| 2018 | $2,613 | $372,000 | $99,632 | $272,368 |
| 2016 | $2,487 | $182,710 | $41,842 | $140,868 |
| 2015 | $2,548 | $177,705 | $41,842 | $135,863 |
| 2014 | $2,663 | $189,900 | $41,842 | $148,058 |
| 2013 | -- | $155,100 | $42,358 | $112,742 |
Source: Public Records
Map
Nearby Homes
- 796 S Rock Creek Corner
- 583 S Alberta Spruce Dr
- 557 S Angel St
- 920 S 1700 W Unit 1
- 2182 W Evergreen Way Unit 143
- 1124 S Neville St
- 1015 W 350 S
- 1042 W Shoreline Dr
- Creighton Farmhouse Plan at Angel Hill
- 37 N Swift Creek Dr
- 1234 S Grace Way
- 296 S 950 W
- 362 S 950 W
- 1278 S Grace Way
- 562 S 850 W
- 1038 S Old Towne Rd
- 163 Cold Creek Way
- 1606 W 200 N
- 774 W Farming Way
- 2184 W Gentile St