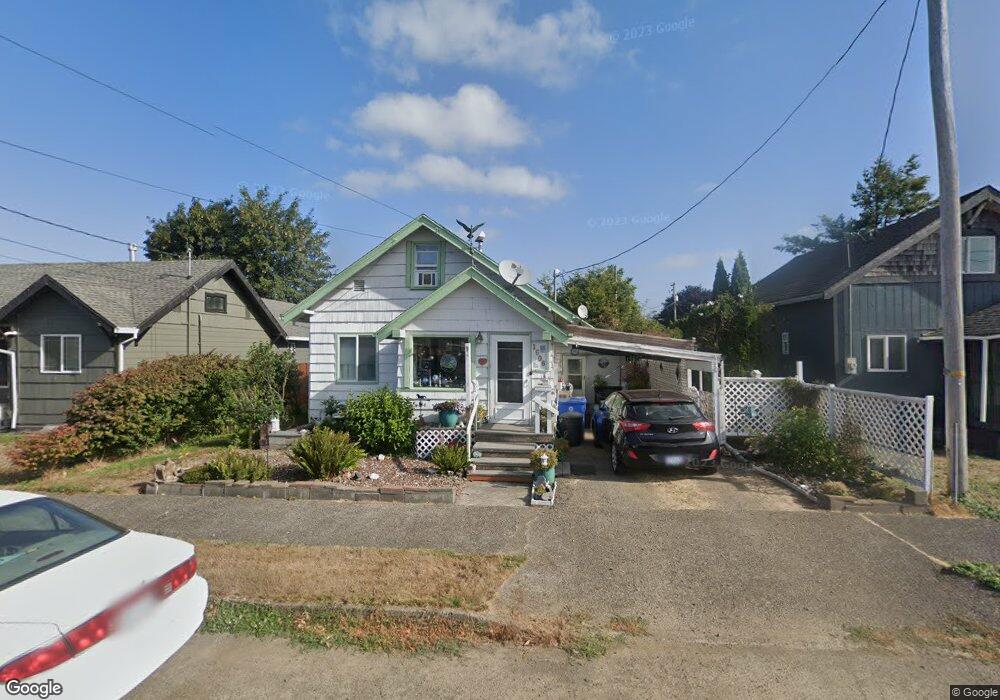
1606 2nd St Tillamook, OR 97141
Estimated Value: $239,000 - $296,000
2
Beds
1
Bath
696
Sq Ft
$382/Sq Ft
Est. Value
About This Home
This home is located at 1606 2nd St, Tillamook, OR 97141 and is currently estimated at $266,026, approximately $382 per square foot. 1606 2nd St is a home located in Tillamook County with nearby schools including Tillamook High School, Little Clipper Preschool, and Tillamook Adventist School.
Ownership History
Date
Name
Owned For
Owner Type
Purchase Details
Closed on
May 19, 2011
Sold by
Hart Robert E and Hart Phyllis E
Bought by
Hart Robert E and Hart Phyllis E
Current Estimated Value
Purchase Details
Closed on
Jun 8, 2006
Sold by
Lalonde Judith Marie
Bought by
Hart Robert E and Hart Phyllis E
Purchase Details
Closed on
Sep 30, 2005
Sold by
Taylor Richard H
Bought by
Lalonde Judith M
Create a Home Valuation Report for This Property
The Home Valuation Report is an in-depth analysis detailing your home's value as well as a comparison with similar homes in the area
Home Values in the Area
Average Home Value in this Area
Purchase History
| Date | Buyer | Sale Price | Title Company |
|---|---|---|---|
| Hart Robert E | -- | None Available | |
| Hart Robert E | -- | None Available | |
| Lalonde Judith M | $10,000 | -- |
Source: Public Records
Tax History Compared to Growth
Tax History
| Year | Tax Paid | Tax Assessment Tax Assessment Total Assessment is a certain percentage of the fair market value that is determined by local assessors to be the total taxable value of land and additions on the property. | Land | Improvement |
|---|---|---|---|---|
| 2024 | $689 | $83,370 | $47,190 | $36,180 |
| 2023 | $683 | $80,950 | $45,820 | $35,130 |
| 2022 | $660 | $78,600 | $44,490 | $34,110 |
| 2021 | $641 | $76,320 | $43,190 | $33,130 |
| 2020 | $624 | $74,100 | $41,930 | $32,170 |
| 2019 | $608 | $71,950 | $40,710 | $31,240 |
| 2018 | $593 | $69,860 | $39,520 | $30,340 |
| 2017 | $578 | $67,830 | $38,370 | $29,460 |
| 2016 | $557 | $65,860 | $37,260 | $28,600 |
| 2015 | $546 | $63,950 | $36,180 | $27,770 |
| 2014 | $537 | $62,090 | $35,130 | $26,960 |
| 2013 | -- | $60,290 | $34,120 | $26,170 |
Source: Public Records
Map
Nearby Homes
- 1708 4th St
- 1703 4th St
- 1706 5th St
- 1307 3rd St
- 514 Elm Ave
- 315 Birch Ave
- 412 Birch Ave
- 1806 8th St
- 1209 6th St
- 1412 9th St
- 1009/1011 Grove Ave Unit 1009-11
- 17805 U S 101
- 00101 Wilson River Hwy
- 00201 Wilson River Hwy
- TL #00101 Wilson River Hwy
- TL# 02100 Wilson River Hwy
- Parcel 1 Wilson River Hwy
- Parcel 2 Wilson River Hwy
- 500 etc. Wilson River Hwy
- 1003 Grove Ave