Estimated Value: $128,750 - $143,000
3
Beds
1
Bath
1,476
Sq Ft
$92/Sq Ft
Est. Value
About This Home
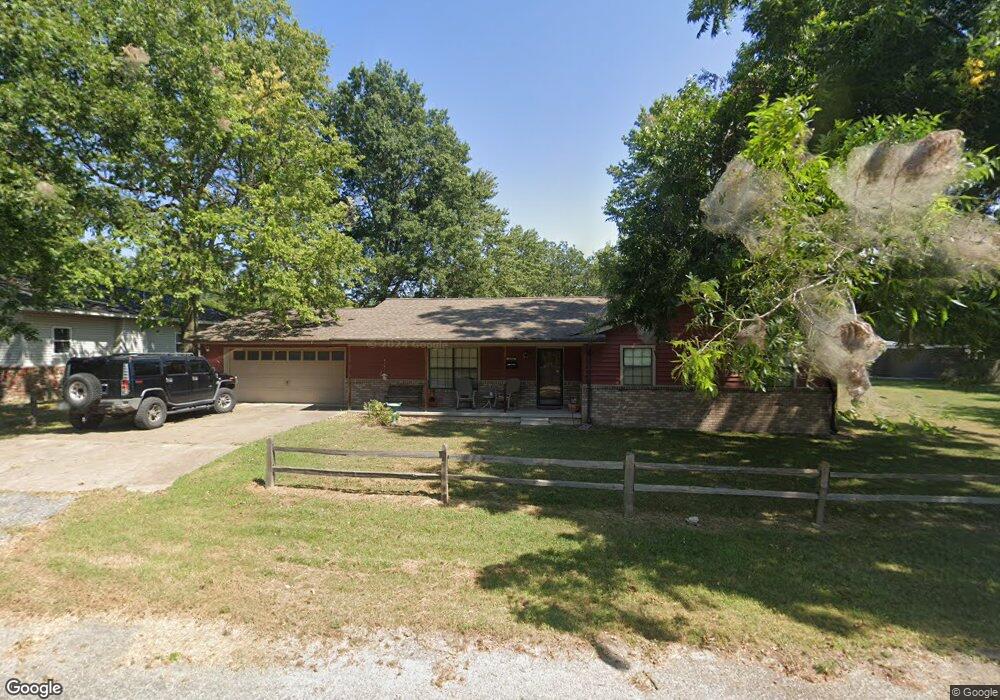
This home is located at 1606 C St NE, Miami, OK 74354 and is currently estimated at $135,688, approximately $91 per square foot. 1606 C St NE is a home located in Ottawa County with nearby schools including Miami High School and Mt. Olive Lutheran School.
Ownership History
Date
Name
Owned For
Owner Type
Purchase Details
Closed on
Jun 27, 2007
Sold by
Sherard Irene and Sherard Gary L
Bought by
Belcher James L and Belcher Karen Sue
Current Estimated Value
Home Financials for this Owner
Home Financials are based on the most recent Mortgage that was taken out on this home.
Original Mortgage
$70,050
Outstanding Balance
$42,863
Interest Rate
6.19%
Mortgage Type
VA
Estimated Equity
$92,825
Purchase Details
Closed on
Apr 1, 2006
Sold by
Sherard Irene
Bought by
Sherard Irene and Sherard Gary L
Purchase Details
Closed on
Aug 18, 1992
Bought by
Irene Tom and Irene Sherard
Create a Home Valuation Report for This Property
The Home Valuation Report is an in-depth analysis detailing your home's value as well as a comparison with similar homes in the area
Home Values in the Area
Average Home Value in this Area
Purchase History
| Date | Buyer | Sale Price | Title Company |
|---|---|---|---|
| Belcher James L | $70,500 | None Available | |
| Sherard Irene | -- | None Available | |
| Irene Tom | $46,000 | -- |
Source: Public Records
Mortgage History
| Date | Status | Borrower | Loan Amount |
|---|---|---|---|
| Open | Belcher James L | $70,050 |
Source: Public Records
Tax History Compared to Growth
Tax History
| Year | Tax Paid | Tax Assessment Tax Assessment Total Assessment is a certain percentage of the fair market value that is determined by local assessors to be the total taxable value of land and additions on the property. | Land | Improvement |
|---|---|---|---|---|
| 2025 | -- | $10,670 | $570 | $10,100 |
| 2024 | -- | $10,162 | $553 | $9,609 |
| 2023 | $0 | $9,865 | $551 | $9,314 |
| 2022 | $0 | $9,578 | $549 | $9,029 |
| 2021 | $879 | $9,299 | $546 | $8,753 |
| 2020 | $765 | $9,028 | $544 | $8,484 |
| 2019 | $638 | $8,766 | $536 | $8,230 |
| 2018 | $629 | $8,607 | $536 | $8,071 |
| 2017 | $618 | $8,357 | $536 | $7,821 |
| 2016 | $571 | $8,113 | $536 | $7,577 |
| 2015 | $478 | $5,375 | $741 | $4,634 |
| 2014 | $563 | $7,877 | $798 | $7,079 |
Source: Public Records
Map
Nearby Homes