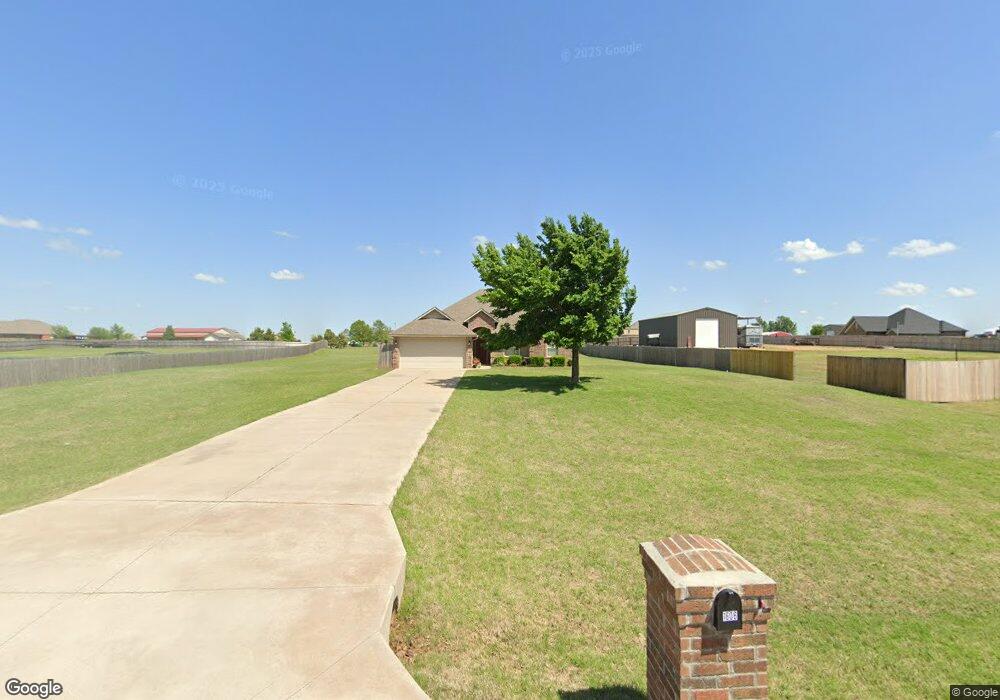
1606 Camelot St Tuttle, OK 73089
Estimated Value: $312,726 - $383,000
3
Beds
2
Baths
1,887
Sq Ft
$178/Sq Ft
Est. Value
About This Home
This home is located at 1606 Camelot St, Tuttle, OK 73089 and is currently estimated at $336,182, approximately $178 per square foot. 1606 Camelot St is a home located in Grady County with nearby schools including Tuttle Elementary School, Tuttle Intermediate School, and Tuttle Middle School.
Ownership History
Date
Name
Owned For
Owner Type
Purchase Details
Closed on
Aug 20, 2009
Sold by
L 2 Construction Llc
Bought by
Tate Pamela L
Current Estimated Value
Purchase Details
Closed on
Dec 19, 2007
Sold by
Richland Hills Development Inc
Bought by
L-2 Construction Llc
Home Financials for this Owner
Home Financials are based on the most recent Mortgage that was taken out on this home.
Original Mortgage
$126,566
Interest Rate
6.23%
Mortgage Type
Unknown
Create a Home Valuation Report for This Property
The Home Valuation Report is an in-depth analysis detailing your home's value as well as a comparison with similar homes in the area
Home Values in the Area
Average Home Value in this Area
Purchase History
| Date | Buyer | Sale Price | Title Company |
|---|---|---|---|
| Tate Pamela L | $167,500 | Stewart Abstract & Title Of | |
| L-2 Construction Llc | $27,500 | Stewart Abstract & Title Of |
Source: Public Records
Mortgage History
| Date | Status | Borrower | Loan Amount |
|---|---|---|---|
| Previous Owner | L-2 Construction Llc | $126,566 | |
| Closed | Tate Pamela L | $0 |
Source: Public Records
Tax History
| Year | Tax Paid | Tax Assessment Tax Assessment Total Assessment is a certain percentage of the fair market value that is determined by local assessors to be the total taxable value of land and additions on the property. | Land | Improvement |
|---|---|---|---|---|
| 2025 | $2,420 | $23,972 | $3,017 | $20,955 |
| 2024 | $2,530 | $23,274 | $2,930 | $20,344 |
| 2023 | $2,530 | $22,596 | $3,268 | $19,328 |
| 2022 | $2,300 | $21,937 | $3,268 | $18,669 |
| 2021 | $2,239 | $21,299 | $3,268 | $18,031 |
| 2020 | $2,253 | $21,216 | $3,268 | $17,948 |
| 2019 | $2,146 | $20,598 | $3,268 | $17,330 |
| 2018 | $2,041 | $20,737 | $3,260 | $17,477 |
| 2017 | $2,030 | $20,134 | $3,180 | $16,954 |
| 2016 | $2,004 | $19,547 | $3,124 | $16,423 |
| 2015 | $1,785 | $18,978 | $2,640 | $16,338 |
| 2014 | $1,785 | $18,425 | $3,025 | $15,400 |
Source: Public Records
Map
Nearby Homes
- 1330 E Silver City Ridge
- 803 N Richland Rd
- 0 Frisco Rd
- 106 Englebretson Ln
- 302 NW 1st St
- 579 N Cemetery Rd
- 215 N Cemetery Rd
- 309 Elm St
- 104 SE 2nd St
- 102 SE 1st St
- 516 Kings Ct
- 601 S Frisco Rd
- 10 Westend Ct
- 17 S Cemetery Rd
- 9 Southpointe Ave
- 502 SW 5th St
- 3716 Prairie Creek Dr
- 605 SW 4th St
- 1301 E Rock Creek Rd
- 1260 E Rock Creek Rd
Your Personal Tour Guide
Ask me questions while you tour the home.