Estimated Value: $81,000 - $133,000
3
Beds
1
Bath
1,272
Sq Ft
$90/Sq Ft
Est. Value
About This Home
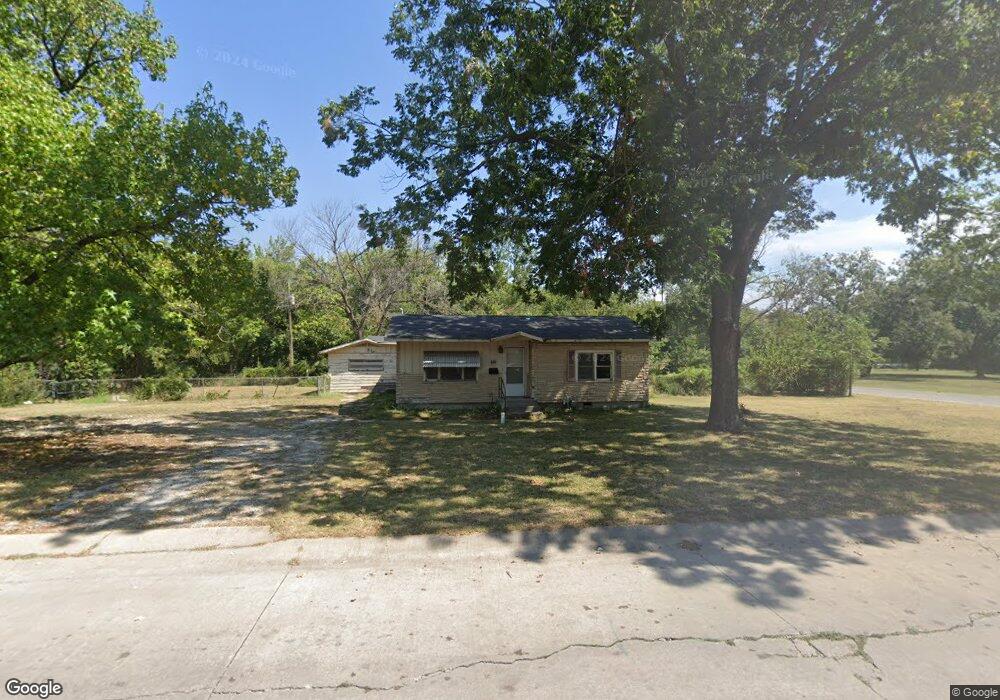
This home is located at 1606 D St NE, Miami, OK 74354 and is currently estimated at $113,981, approximately $89 per square foot. 1606 D St NE is a home located in Ottawa County with nearby schools including Miami High School and Mt. Olive Lutheran School.
Ownership History
Date
Name
Owned For
Owner Type
Purchase Details
Closed on
Jul 10, 2015
Sold by
Kerr Sean C and Kerr Tracee D
Bought by
Gonzalez Maria Teresa
Current Estimated Value
Home Financials for this Owner
Home Financials are based on the most recent Mortgage that was taken out on this home.
Original Mortgage
$15,851
Outstanding Balance
$12,420
Interest Rate
4.08%
Mortgage Type
Future Advance Clause Open End Mortgage
Estimated Equity
$101,561
Purchase Details
Closed on
May 15, 1998
Bought by
Kerr Sean C and Kerr Tracee D
Purchase Details
Closed on
Mar 17, 1993
Bought by
Forrester Bruce and Forrester Terri
Create a Home Valuation Report for This Property
The Home Valuation Report is an in-depth analysis detailing your home's value as well as a comparison with similar homes in the area
Home Values in the Area
Average Home Value in this Area
Purchase History
| Date | Buyer | Sale Price | Title Company |
|---|---|---|---|
| Gonzalez Maria Teresa | $19,000 | Ottawa County Abstract & Tit | |
| Kerr Sean C | $29,500 | -- | |
| Forrester Bruce | $23,500 | -- |
Source: Public Records
Mortgage History
| Date | Status | Borrower | Loan Amount |
|---|---|---|---|
| Open | Gonzalez Maria Teresa | $15,851 |
Source: Public Records
Tax History Compared to Growth
Tax History
| Year | Tax Paid | Tax Assessment Tax Assessment Total Assessment is a certain percentage of the fair market value that is determined by local assessors to be the total taxable value of land and additions on the property. | Land | Improvement |
|---|---|---|---|---|
| 2025 | $504 | $5,492 | $1,364 | $4,128 |
| 2024 | $504 | $5,230 | $1,299 | $3,931 |
| 2023 | $504 | $4,981 | $1,227 | $3,754 |
| 2022 | $439 | $4,745 | $1,173 | $3,572 |
| 2021 | $427 | $4,518 | $1,120 | $3,398 |
| 2020 | $410 | $4,303 | $1,071 | $3,232 |
| 2019 | $337 | $4,099 | $995 | $3,104 |
| 2018 | $323 | $3,903 | $941 | $2,962 |
| 2017 | $312 | $3,717 | $890 | $2,827 |
| 2016 | $284 | $3,541 | $842 | $2,699 |
| 2015 | $211 | $3,372 | $802 | $2,570 |
| 2014 | $194 | $3,372 | $802 | $2,570 |
Source: Public Records
Map
Nearby Homes