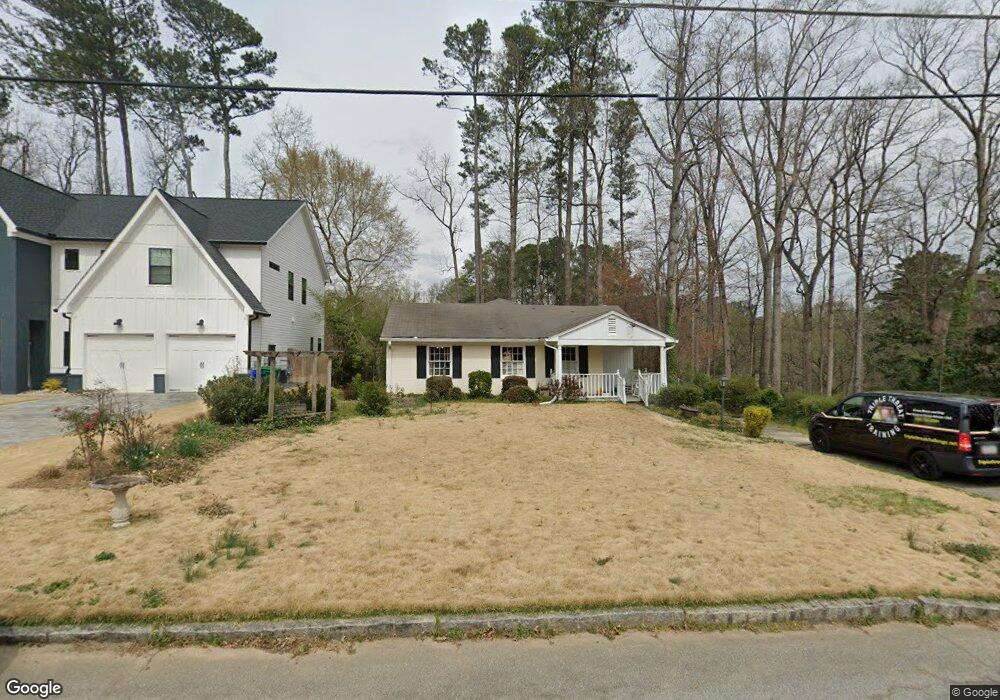
1606 Fearn Cir NE Atlanta, GA 30319
Drew Valley NeighborhoodEstimated Value: $732,000 - $776,000
3
Beds
2
Baths
1,684
Sq Ft
$444/Sq Ft
Est. Value
About This Home
This home is located at 1606 Fearn Cir NE, Atlanta, GA 30319 and is currently estimated at $748,029, approximately $444 per square foot. 1606 Fearn Cir NE is a home located in DeKalb County with nearby schools including Dekalb Path Academy Charter School, Chamblee Charter High School, and The Piedmont School Of Atlanta.
Ownership History
Date
Name
Owned For
Owner Type
Purchase Details
Closed on
Sep 7, 2007
Sold by
Shenton Gregory O
Bought by
Stephens Peter J
Current Estimated Value
Home Financials for this Owner
Home Financials are based on the most recent Mortgage that was taken out on this home.
Original Mortgage
$259,500
Outstanding Balance
$163,376
Interest Rate
6.55%
Mortgage Type
New Conventional
Estimated Equity
$584,653
Purchase Details
Closed on
Feb 22, 2002
Sold by
Frederick Douglas R and Frederick Mary S
Bought by
Shenton Gregory O
Home Financials for this Owner
Home Financials are based on the most recent Mortgage that was taken out on this home.
Original Mortgage
$216,000
Interest Rate
3.88%
Mortgage Type
New Conventional
Purchase Details
Closed on
Feb 28, 1997
Sold by
Gunningham Hugh Catharine
Bought by
Frederick Douglas Mary
Create a Home Valuation Report for This Property
The Home Valuation Report is an in-depth analysis detailing your home's value as well as a comparison with similar homes in the area
Home Values in the Area
Average Home Value in this Area
Purchase History
| Date | Buyer | Sale Price | Title Company |
|---|---|---|---|
| Stephens Peter J | $346,000 | -- | |
| Shenton Gregory O | $270,000 | -- | |
| Frederick Douglas Mary | $152,000 | -- |
Source: Public Records
Mortgage History
| Date | Status | Borrower | Loan Amount |
|---|---|---|---|
| Open | Stephens Peter J | $259,500 | |
| Previous Owner | Shenton Gregory O | $216,000 | |
| Closed | Frederick Douglas Mary | $0 |
Source: Public Records
Tax History Compared to Growth
Tax History
| Year | Tax Paid | Tax Assessment Tax Assessment Total Assessment is a certain percentage of the fair market value that is determined by local assessors to be the total taxable value of land and additions on the property. | Land | Improvement |
|---|---|---|---|---|
| 2025 | $6,753 | $259,200 | $140,000 | $119,200 |
| 2024 | $6,846 | $262,240 | $140,000 | $122,240 |
| 2023 | $6,846 | $254,320 | $140,000 | $114,320 |
| 2022 | $5,750 | $214,240 | $140,000 | $74,240 |
| 2021 | $5,375 | $198,320 | $140,000 | $58,320 |
| 2020 | $4,625 | $162,680 | $140,000 | $22,680 |
| 2019 | $4,729 | $168,920 | $140,000 | $28,920 |
| 2018 | $4,409 | $155,360 | $140,000 | $15,360 |
| 2017 | $4,799 | $154,080 | $95,530 | $58,550 |
| 2016 | $4,692 | $154,080 | $95,530 | $58,550 |
| 2014 | $4,353 | $136,600 | $72,280 | $64,320 |
Source: Public Records
Map
Nearby Homes
- 1677 Wayland Cir NE
- 1641 Richwood Dr NE Unit 2
- 2585 Drew Valley Rd NE
- 2385 Nesbitt Dr NE
- 2601 Drew Valley Rd NE
- 1563 Dresden Dr NE
- 2394 Burch Cir NE
- 1460 Grant Dr NE
- 2047 Drew Valley Rd NE
- 1575 Trentwood Place NE
- 2355 Ewing Dr NE
- 2582 N Thompson Rd NE
- 2493 Oostanaula Dr NE
- 2070 Drew Valley Rd NE
- 2425 Oostanaula Dr NE
- 1602 Fearn Cir NE
- 1610 Fearn Cir NE
- 1603 Grant Dr NE
- 1607 Grant Dr NE
- 1599 Grant Dr NE
- 1616 Fearn Cir NE
- 1607 Fearn Cir NE Unit 2
- 1592 Fearn Cir NE
- 1603 Fearn Cir NE
- 1619 Fearn Cir NE
- 1593 Grant Dr NE
- 1595 Fearn Cir NE
- 2475 Alta Vista Dr NE
- 1620 Fearn Cir NE
- 1586 Fearn Cir NE
- 1591 Fearn Cir NE
- 1631 Fearn Cir NE
- 1587 Grant Dr NE
- 2481 Alta Vista Dr NE
- 0 Fearn Cir NE Unit 7406566