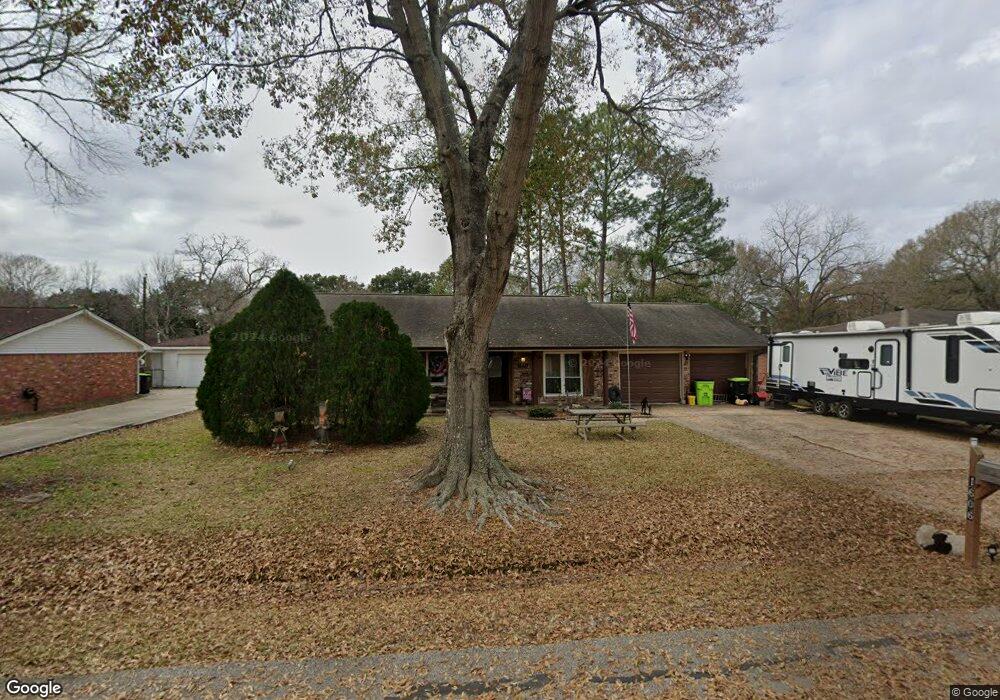
1606 Laurel Oaks Dr Richmond, TX 77469
Estimated Value: $240,000 - $270,000
3
Beds
2
Baths
1,820
Sq Ft
$139/Sq Ft
Est. Value
About This Home
This home is located at 1606 Laurel Oaks Dr, Richmond, TX 77469 and is currently estimated at $252,122, approximately $138 per square foot. 1606 Laurel Oaks Dr is a home located in Fort Bend County with nearby schools including Smith Elementary School, J J Wessendorff Middle School, and Lamar Junior High School.
Ownership History
Date
Name
Owned For
Owner Type
Purchase Details
Closed on
May 25, 2000
Sold by
Brenan Heather H and Weber John
Bought by
Price Jimmy Dwayne and Price Nancy
Current Estimated Value
Home Financials for this Owner
Home Financials are based on the most recent Mortgage that was taken out on this home.
Original Mortgage
$89,165
Outstanding Balance
$30,870
Interest Rate
8.17%
Mortgage Type
FHA
Estimated Equity
$221,252
Purchase Details
Closed on
Jun 27, 1997
Sold by
Hopmann Carolyn E
Bought by
Brenan Heather H
Home Financials for this Owner
Home Financials are based on the most recent Mortgage that was taken out on this home.
Original Mortgage
$72,200
Interest Rate
7.93%
Mortgage Type
Purchase Money Mortgage
Create a Home Valuation Report for This Property
The Home Valuation Report is an in-depth analysis detailing your home's value as well as a comparison with similar homes in the area
Home Values in the Area
Average Home Value in this Area
Purchase History
| Date | Buyer | Sale Price | Title Company |
|---|---|---|---|
| Price Jimmy Dwayne | -- | Regency Title | |
| Brenan Heather H | -- | Fort Bend Title Co | |
| Price Jimmy Dwayne | -- | -- |
Source: Public Records
Mortgage History
| Date | Status | Borrower | Loan Amount |
|---|---|---|---|
| Open | Price Jimmy Dwayne | $89,165 | |
| Previous Owner | Price Jimmy Dwayne | $72,200 |
Source: Public Records
Tax History Compared to Growth
Tax History
| Year | Tax Paid | Tax Assessment Tax Assessment Total Assessment is a certain percentage of the fair market value that is determined by local assessors to be the total taxable value of land and additions on the property. | Land | Improvement |
|---|---|---|---|---|
| 2025 | $3,505 | $206,514 | $31,460 | $175,054 |
| 2024 | $3,505 | $221,309 | $27,501 | $193,808 |
| 2023 | $3,144 | $201,190 | $1,718 | $199,472 |
| 2022 | $3,609 | $182,900 | $11,700 | $171,200 |
| 2021 | $3,949 | $166,270 | $24,200 | $142,070 |
| 2020 | $4,011 | $166,440 | $22,000 | $144,440 |
| 2019 | $3,963 | $155,180 | $22,000 | $133,180 |
| 2018 | $3,624 | $141,070 | $22,000 | $119,070 |
| 2017 | $3,460 | $133,120 | $18,500 | $114,620 |
| 2016 | $3,226 | $124,130 | $18,500 | $105,630 |
| 2015 | $2,715 | $120,870 | $18,500 | $102,370 |
| 2014 | $2,631 | $111,110 | $18,500 | $92,610 |
Source: Public Records
Map
Nearby Homes
- 1805 Hawthorn Dr
- 1809 Hawthorn Dr
- 1004 Country Club Dr
- 1806 Cedar Dr
- 1922 Teakwood St
- 1109 Frances Dr
- 2015 Tanglelane St
- 0 Meadow Ln
- 805 Chateau Place
- 2001 Briar Ln
- 0 Fm 2218 Unit 25550047
- 512 and 514 Travis St
- 4502 River Rd
- 400 Hillcrest Dr
- 7315 Audubon Russet Dr
- 7322 Audubon Russet Dr
- 2143 Alabaster Estate Dr
- 606 Fannin St
- 406 Fairway Dr
- 6219 Deep Gulch Dr
- 1608 Laurel Oaks Dr
- 1604 Laurel Oaks Dr
- 1410 Evergreen Ct
- 1610 Laurel Oaks Dr
- 1605 Lamar Dr
- 1602 Laurel Oaks Dr
- 1611 Laurel Oaks Dr
- 1609 Laurel Oaks Dr
- 1408 Evergreen Ct
- 1613 Laurel Oaks Dr
- 1412 Evergreen Ct
- 1607 Laurel Oaks Dr
- 1612 Laurel Oaks Dr
- 1601 Lamar Dr
- 1615 Laurel Oaks Dr
- 1615 Laurel Oaks Dr
- 1502 Hawthorn Dr
- 1605 Laurel Oaks Dr
- 1409 Evergreen Ct
- 1700 Magnolia Ln