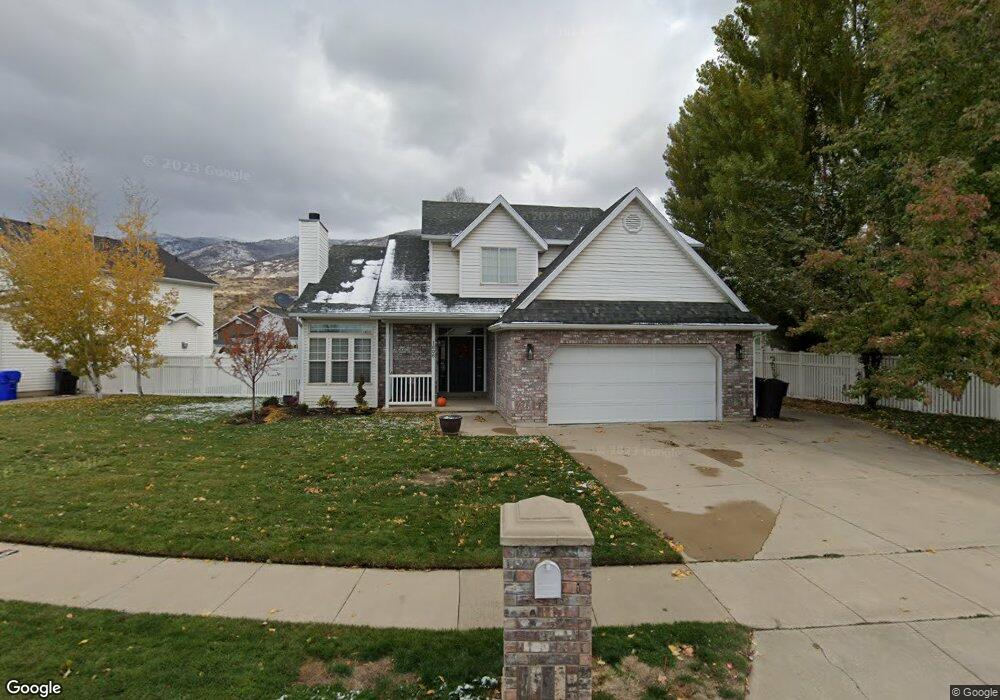
1606 Lewis And Clark Dr Centerville, UT 84014
Estimated Value: $552,485 - $580,000
3
Beds
3
Baths
1,944
Sq Ft
$291/Sq Ft
Est. Value
About This Home
This home is located at 1606 Lewis And Clark Dr, Centerville, UT 84014 and is currently estimated at $566,621, approximately $291 per square foot. 1606 Lewis And Clark Dr is a home located in Davis County with nearby schools including Stewart Elementary School, Centerville Jr High, and Viewmont High School.
Ownership History
Date
Name
Owned For
Owner Type
Purchase Details
Closed on
Jun 10, 2020
Sold by
Pobst Aaron
Bought by
Pobst Aaron and Pobst Kristy
Current Estimated Value
Home Financials for this Owner
Home Financials are based on the most recent Mortgage that was taken out on this home.
Original Mortgage
$351,380
Outstanding Balance
$310,782
Interest Rate
3.2%
Mortgage Type
New Conventional
Estimated Equity
$255,839
Purchase Details
Closed on
Dec 5, 2019
Sold by
Piggott Joanne
Bought by
Piggott Richard
Home Financials for this Owner
Home Financials are based on the most recent Mortgage that was taken out on this home.
Original Mortgage
$150,000
Interest Rate
3.75%
Mortgage Type
Commercial
Purchase Details
Closed on
Jun 29, 2000
Sold by
Chapman Gary L
Bought by
Piggott Joanne
Create a Home Valuation Report for This Property
The Home Valuation Report is an in-depth analysis detailing your home's value as well as a comparison with similar homes in the area
Home Values in the Area
Average Home Value in this Area
Purchase History
| Date | Buyer | Sale Price | Title Company |
|---|---|---|---|
| Pobst Aaron | -- | Backman Title Service | |
| Pobst Aaron | -- | Us Title Company Of | |
| Piggott Richard | -- | Us Title Company O | |
| Piggott Joanne | -- | -- |
Source: Public Records
Mortgage History
| Date | Status | Borrower | Loan Amount |
|---|---|---|---|
| Open | Pobst Aaron | $351,380 | |
| Previous Owner | Piggott Richard | $150,000 |
Source: Public Records
Tax History Compared to Growth
Tax History
| Year | Tax Paid | Tax Assessment Tax Assessment Total Assessment is a certain percentage of the fair market value that is determined by local assessors to be the total taxable value of land and additions on the property. | Land | Improvement |
|---|---|---|---|---|
| 2025 | $3,164 | $282,700 | $159,556 | $123,144 |
| 2024 | $2,983 | $272,250 | $142,520 | $129,730 |
| 2023 | $2,845 | $472,000 | $234,950 | $237,050 |
| 2022 | $2,984 | $274,450 | $118,397 | $156,053 |
| 2021 | $2,647 | $378,000 | $179,322 | $198,678 |
| 2020 | $2,215 | $314,158 | $175,874 | $138,284 |
| 2019 | $2,221 | $310,000 | $179,271 | $130,729 |
| 2018 | $2,085 | $281,000 | $166,466 | $114,534 |
| 2016 | $1,885 | $137,885 | $52,715 | $85,170 |
| 2015 | $1,824 | $126,115 | $52,715 | $73,400 |
| 2014 | $1,848 | $131,608 | $52,715 | $78,893 |
| 2013 | -- | $130,251 | $47,025 | $83,226 |
Source: Public Records
Map
Nearby Homes
- 733 W 1825 N
- 1927 N 450 W
- 455 W 2025 N
- 1851 N Main St
- 732 W 1175 N
- 1238 N 450 W
- 1441 N Main St
- 43 E 1825 N
- 1154 N 700 W
- 581 W Summerhill Ln
- 551 W Summerhill Ln
- 283 W Summerhill Ln
- 429 W 1050 N
- 56 E 2050 N
- 5 W Summerhill Ln
- Cantata Plan at Summerhill Lane
- Kilby Plan at Summerhill Lane
- Rhapsody Plan at Summerhill Lane
- Ballad Plan at Summerhill Lane
- Grand Plan at Summerhill Lane
- 682 Freemont Cir
- 682 Fremont Cir
- 1614 Lewis And Clark Dr
- 662 Freemont Cir
- 1605 Lewis And Clark Dr
- 1597 N Lewis & Clark Dr
- 1615 Lewis And Clark Dr
- 1622 Lewis And Clark Dr
- 1597 Lewis And Clark Dr
- 642 Freemont Cir
- 673 Jim Bridger Dr
- 1593 Lewis And Clark Dr
- 1589 Lewis And Clark Dr
- 649 Freemont Cir
- 759 Jim Bridger Dr
- 649 Fremont Cir
- 639 Jim Bridger Dr
- 639 Jim Bridger Dr Unit 1650
- 627 Freemont Cir
- 1587 Lewis And Clark Dr