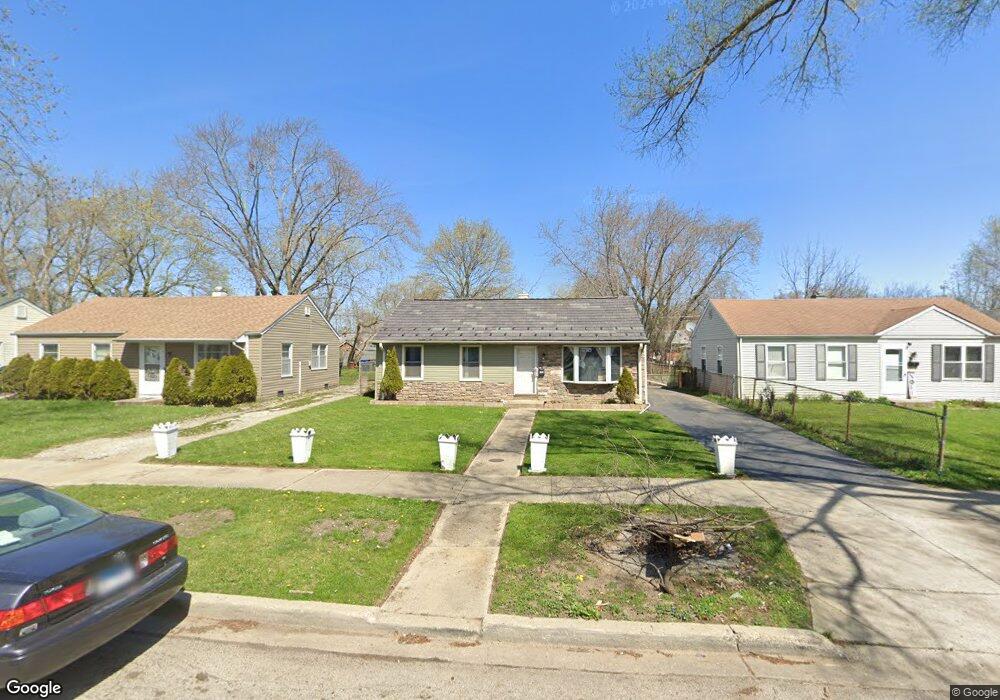
1606 Lyons Ct Waukegan, IL 60085
Lewis Glenn NeighborhoodEstimated Value: $141,000 - $246,000
3
Beds
1
Bath
1,308
Sq Ft
$146/Sq Ft
Est. Value
About This Home
This home is located at 1606 Lyons Ct, Waukegan, IL 60085 and is currently estimated at $190,997, approximately $146 per square foot. 1606 Lyons Ct is a home located in Lake County with nearby schools including Clearview Elementary School, John R Lewis Middle School, and Waukegan High School.
Ownership History
Date
Name
Owned For
Owner Type
Purchase Details
Closed on
Feb 26, 2021
Sold by
Allwardt Mary and Allwardt Wayne
Bought by
Almazan Angelica M Perez
Current Estimated Value
Purchase Details
Closed on
Jun 14, 2018
Sold by
Allwardt Mary
Bought by
Almazan Angelica Perez and Gonzales Garcia Nery V
Purchase Details
Closed on
Jul 10, 2002
Sold by
Jones Bobbie and Jones Ceasar
Bought by
Allwardt Mary
Purchase Details
Closed on
Mar 16, 2001
Sold by
Jones Bobbie J
Bought by
Williams Cheryl
Create a Home Valuation Report for This Property
The Home Valuation Report is an in-depth analysis detailing your home's value as well as a comparison with similar homes in the area
Home Values in the Area
Average Home Value in this Area
Purchase History
| Date | Buyer | Sale Price | Title Company |
|---|---|---|---|
| Almazan Angelica M Perez | $89,000 | Attorney | |
| Almazan Angelica Perez | $89,000 | None Available | |
| Allwardt Mary | $81,000 | -- | |
| Williams Cheryl | -- | -- |
Source: Public Records
Tax History
| Year | Tax Paid | Tax Assessment Tax Assessment Total Assessment is a certain percentage of the fair market value that is determined by local assessors to be the total taxable value of land and additions on the property. | Land | Improvement |
|---|---|---|---|---|
| 2024 | $3,731 | $49,137 | $8,353 | $40,784 |
| 2023 | $3,519 | $40,326 | $6,855 | $33,471 |
| 2022 | $3,519 | $36,486 | $5,985 | $30,501 |
| 2021 | $3,824 | $37,299 | $5,339 | $31,960 |
| 2020 | $3,875 | $34,749 | $4,974 | $29,775 |
| 2019 | $3,175 | $31,842 | $4,558 | $27,284 |
| 2018 | $3,733 | $35,613 | $4,031 | $31,582 |
| 2017 | $3,580 | $31,507 | $3,566 | $27,941 |
| 2016 | $4,179 | $27,379 | $3,099 | $24,280 |
| 2015 | $4,039 | $24,505 | $2,774 | $21,731 |
| 2014 | $2,903 | $17,419 | $2,391 | $15,028 |
| 2012 | $3,582 | $18,872 | $2,590 | $16,282 |
Source: Public Records
Map
Nearby Homes
- 1517 Lyons Ct
- 1241 S Elmwood Ave
- 1617 Grove Ave
- 1712 11th St
- 1919 16th St
- 1548 Jackson St
- 1247 Victoria Ave
- 1542 Victoria Ave
- 1738 Seymour Ave
- 821 12th St
- 1210 Park Ave
- 720 13th St
- 822 11th St
- 816 18th St
- 724 10th St
- 1009 8th St
- 1213 Washington Park
- 1620 Sheridan Rd
- 706 Broadway Ave
- 1130 Sheridan Rd
Your Personal Tour Guide
Ask me questions while you tour the home.