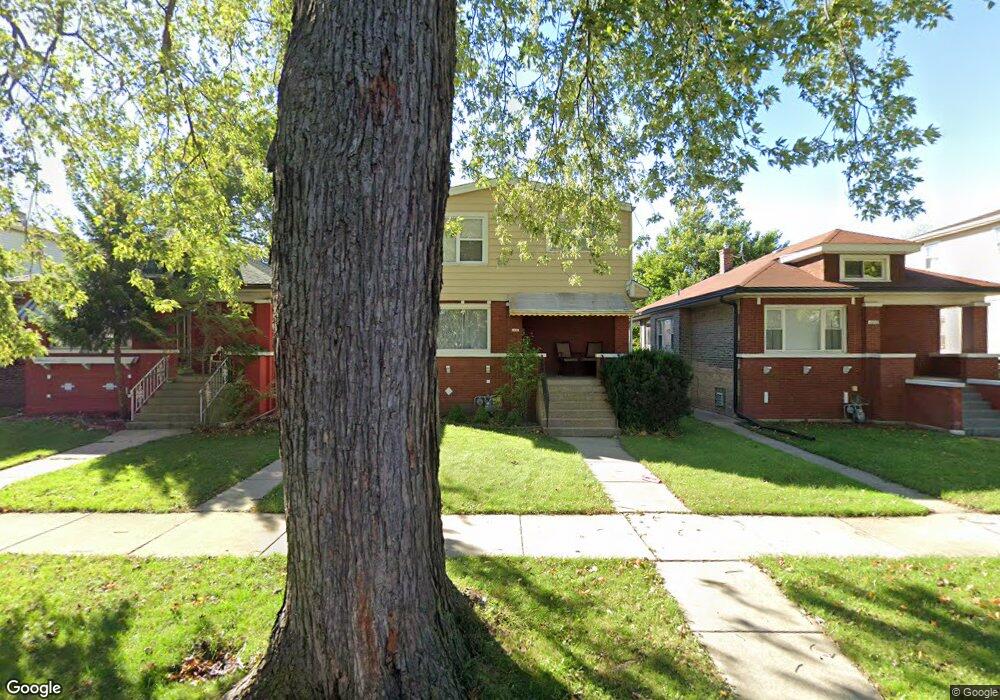
1606 N 16th Ave Melrose Park, IL 60160
Estimated Value: $325,000 - $479,000
5
Beds
2
Baths
2,132
Sq Ft
$187/Sq Ft
Est. Value
About This Home
This home is located at 1606 N 16th Ave, Melrose Park, IL 60160 and is currently estimated at $399,469, approximately $187 per square foot. 1606 N 16th Ave is a home located in Cook County with nearby schools including Jane Addams Elementary School, Stevenson Middle School, and Proviso East High School.
Ownership History
Date
Name
Owned For
Owner Type
Purchase Details
Closed on
Oct 3, 2011
Sold by
Tcf National Bank
Bought by
Trejo Godinez Erick and Romero Lara Rosa Elena
Current Estimated Value
Home Financials for this Owner
Home Financials are based on the most recent Mortgage that was taken out on this home.
Original Mortgage
$152,000
Interest Rate
3.97%
Mortgage Type
Seller Take Back
Purchase Details
Closed on
Mar 17, 2011
Sold by
Velasquez Jose and Velazquez Jose
Bought by
Tcf National Bank
Purchase Details
Closed on
Aug 4, 2006
Sold by
Jankovec John and Jankovec Joyce
Bought by
Velazquez Jose and Velazquez Maria D
Home Financials for this Owner
Home Financials are based on the most recent Mortgage that was taken out on this home.
Original Mortgage
$210,000
Interest Rate
6.83%
Mortgage Type
Unknown
Purchase Details
Closed on
Jan 10, 2001
Sold by
Jankovec John
Bought by
Jankovec John and Jankovec Joyce M
Create a Home Valuation Report for This Property
The Home Valuation Report is an in-depth analysis detailing your home's value as well as a comparison with similar homes in the area
Home Values in the Area
Average Home Value in this Area
Purchase History
| Date | Buyer | Sale Price | Title Company |
|---|---|---|---|
| Trejo Godinez Erick | $160,000 | Atgf Inc | |
| Tcf National Bank | -- | Attorneys Title Guaranty Fun | |
| Velazquez Jose | $310,000 | Chicago Title Insurance Co | |
| Jankovec John | -- | -- |
Source: Public Records
Mortgage History
| Date | Status | Borrower | Loan Amount |
|---|---|---|---|
| Previous Owner | Trejo Godinez Erick | $152,000 | |
| Previous Owner | Velazquez Jose | $210,000 |
Source: Public Records
Tax History Compared to Growth
Tax History
| Year | Tax Paid | Tax Assessment Tax Assessment Total Assessment is a certain percentage of the fair market value that is determined by local assessors to be the total taxable value of land and additions on the property. | Land | Improvement |
|---|---|---|---|---|
| 2024 | $8,233 | $35,000 | $4,072 | $30,928 |
| 2023 | $5,539 | $35,000 | $4,072 | $30,928 |
| 2022 | $5,539 | $21,396 | $3,522 | $17,874 |
| 2021 | $5,652 | $21,395 | $3,521 | $17,874 |
| 2020 | $5,564 | $21,395 | $3,521 | $17,874 |
| 2019 | $6,671 | $24,009 | $3,191 | $20,818 |
| 2018 | $6,645 | $24,009 | $3,191 | $20,818 |
| 2017 | $6,515 | $24,009 | $3,191 | $20,818 |
| 2016 | $6,210 | $21,871 | $2,861 | $19,010 |
| 2015 | $6,074 | $21,871 | $2,861 | $19,010 |
| 2014 | $5,901 | $21,871 | $2,861 | $19,010 |
| 2013 | $6,062 | $24,227 | $2,861 | $21,366 |
Source: Public Records
Map
Nearby Homes
- 1630 N 15th Ave
- 1718 N 15th Ave
- 1209 Helen Dr
- 1724 N 19th Ave
- 1202 Elsie Dr
- 1616 N 12th Ave
- 1540 N 21st Ave
- 923 Division St
- 918 Park Dr
- 1634 N 22nd Ave
- 1514 N 22nd Ave
- 1815 N 22nd Ave
- 1710 N 23rd Ave
- 1933 N 18th Ave
- 1200 N 11th Ave
- 1531 N 24th Ave
- 1114 N 11th Ave
- 1940 N 19th Ave
- 1822 N 23rd Ave
- 1832 N 23rd Ave
- 1604 N 16th Ave
- 1608 N 16th Ave
- 1600 N 16th Ave
- 1612 N 16th Ave
- 1616 N 16th Ave
- 1607 N 17th Ave
- 1618 N 16th Ave
- 1609 N 17th Ave
- 1603 N 17th Ave
- 1613 N 17th Ave
- 1540 N 16th Ave
- 1615 N 17th Ave
- 1620 N 16th Ave
- 1607 N 16th Ave
- 1603 N 16th Ave
- 1609 N 16th Ave
- 1601 N 16th Ave
- 1613 N 16th Ave
- 1617 N 17th Ave
- 1536 N 16th Ave