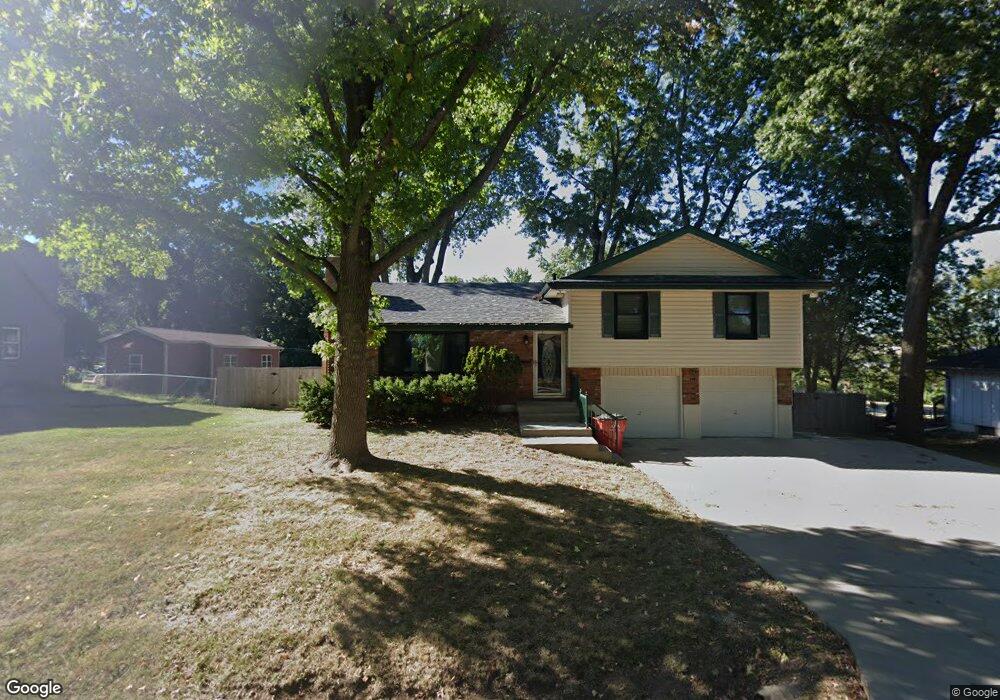
1606 NW A St Blue Springs, MO 64015
Estimated Value: $249,000 - $310,000
3
Beds
2
Baths
1,102
Sq Ft
$245/Sq Ft
Est. Value
About This Home
This home is located at 1606 NW A St, Blue Springs, MO 64015 and is currently estimated at $269,443, approximately $244 per square foot. 1606 NW A St is a home located in Jackson County with nearby schools including Thomas J. Ultican Elementary School, Paul Kinder Middle School, and Blue Springs High School.
Ownership History
Date
Name
Owned For
Owner Type
Purchase Details
Closed on
Sep 28, 2007
Sold by
Murray David A
Bought by
Hagaman Jeff H
Current Estimated Value
Home Financials for this Owner
Home Financials are based on the most recent Mortgage that was taken out on this home.
Original Mortgage
$132,300
Outstanding Balance
$84,149
Interest Rate
6.66%
Mortgage Type
Purchase Money Mortgage
Estimated Equity
$185,294
Purchase Details
Closed on
Mar 23, 2005
Sold by
Parker Robert D
Bought by
Murray David A
Home Financials for this Owner
Home Financials are based on the most recent Mortgage that was taken out on this home.
Original Mortgage
$100,700
Interest Rate
5.62%
Mortgage Type
Purchase Money Mortgage
Purchase Details
Closed on
Aug 25, 2004
Sold by
Lee Donald E and Lee Kathleen S
Bought by
Parker Robert D
Home Financials for this Owner
Home Financials are based on the most recent Mortgage that was taken out on this home.
Original Mortgage
$124,019
Interest Rate
6%
Mortgage Type
FHA
Create a Home Valuation Report for This Property
The Home Valuation Report is an in-depth analysis detailing your home's value as well as a comparison with similar homes in the area
Home Values in the Area
Average Home Value in this Area
Purchase History
| Date | Buyer | Sale Price | Title Company |
|---|---|---|---|
| Hagaman Jeff H | -- | Metro One Title | |
| Murray David A | -- | Coffelt Land Title Inc | |
| Parker Robert D | -- | Stewart Title Of Ks City Inc |
Source: Public Records
Mortgage History
| Date | Status | Borrower | Loan Amount |
|---|---|---|---|
| Open | Hagaman Jeff H | $132,300 | |
| Previous Owner | Murray David A | $100,700 | |
| Previous Owner | Parker Robert D | $124,019 |
Source: Public Records
Tax History Compared to Growth
Tax History
| Year | Tax Paid | Tax Assessment Tax Assessment Total Assessment is a certain percentage of the fair market value that is determined by local assessors to be the total taxable value of land and additions on the property. | Land | Improvement |
|---|---|---|---|---|
| 2025 | $2,111 | $29,759 | $7,005 | $22,754 |
| 2024 | $2,071 | $25,878 | $4,305 | $21,573 |
| 2023 | $2,071 | $25,878 | $2,362 | $23,516 |
| 2022 | $2,271 | $25,080 | $703 | $24,377 |
| 2021 | $2,269 | $25,080 | $703 | $24,377 |
| 2020 | $2,116 | $23,790 | $703 | $23,087 |
| 2019 | $2,045 | $23,790 | $703 | $23,087 |
| 2018 | $2,009 | $22,489 | $4,385 | $18,104 |
| 2017 | $1,953 | $22,489 | $4,385 | $18,104 |
| 2016 | $1,953 | $21,926 | $3,724 | $18,202 |
| 2014 | $1,869 | $20,913 | $3,718 | $17,195 |
Source: Public Records
Map
Nearby Homes
- 305 NW 17th St
- 503 NW 15th St
- 1109 NW B St
- 2317 NW Kensington Ct
- 2000 SW Smith St
- 1705 SW Walnut St
- 2508 NW Castle Dr
- 1109 NW Mock Ave
- 401 SW 18th St
- 913 NW Camelot Ct
- 804 NW Maynard St
- 804 NW North Summit Cir
- 505 SW 18th St
- 516 NW Mill Ct
- 216 SW 26th St
- 1700 SW Mc Arthur St
- 1389 NW Jefferson Ct
- 318 SW 10th St
- 510 SW 12 St
- 2916 NW Chelsea Place