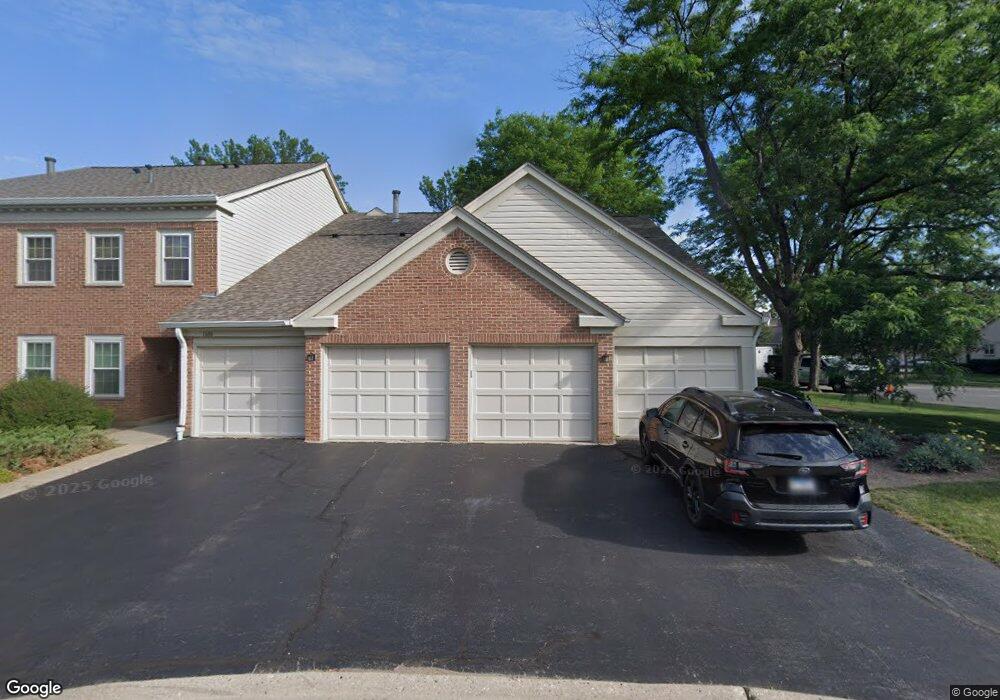
1606 Queens Ct Unit 1443R Wheeling, IL 60090
Estimated Value: $273,244 - $325,000
3
Beds
--
Bath
1,350
Sq Ft
$222/Sq Ft
Est. Value
About This Home
This home is located at 1606 Queens Ct Unit 1443R, Wheeling, IL 60090 and is currently estimated at $299,811, approximately $222 per square foot. 1606 Queens Ct Unit 1443R is a home located in Cook County with nearby schools including Joyce Kilmer Elementary School, Cooper Middle School, and Buffalo Grove High School.
Ownership History
Date
Name
Owned For
Owner Type
Purchase Details
Closed on
Sep 20, 2011
Sold by
Rubenstein Cyrene
Bought by
Rubenstein Cyrene and Cyrene Rubenstein Trust
Current Estimated Value
Purchase Details
Closed on
Jun 19, 1997
Sold by
Mcmahan Peter C and Mcmahan Courtney
Bought by
Rubenstein Cyrene
Home Financials for this Owner
Home Financials are based on the most recent Mortgage that was taken out on this home.
Original Mortgage
$110,000
Outstanding Balance
$15,511
Interest Rate
7.81%
Estimated Equity
$284,300
Purchase Details
Closed on
Apr 21, 1995
Sold by
Bohleen Reynold A and Bohleen Marilee S
Bought by
Mcmahan Peter C and Mcmahan Courtney
Home Financials for this Owner
Home Financials are based on the most recent Mortgage that was taken out on this home.
Original Mortgage
$131,800
Interest Rate
8.25%
Create a Home Valuation Report for This Property
The Home Valuation Report is an in-depth analysis detailing your home's value as well as a comparison with similar homes in the area
Home Values in the Area
Average Home Value in this Area
Purchase History
| Date | Buyer | Sale Price | Title Company |
|---|---|---|---|
| Rubenstein Cyrene | -- | None Available | |
| Rubenstein Cyrene | $150,000 | Attorneys Natl Title Network | |
| Mcmahan Peter C | $146,500 | Ticor Title Insurance |
Source: Public Records
Mortgage History
| Date | Status | Borrower | Loan Amount |
|---|---|---|---|
| Open | Rubenstein Cyrene | $110,000 | |
| Previous Owner | Mcmahan Peter C | $131,800 |
Source: Public Records
Tax History Compared to Growth
Tax History
| Year | Tax Paid | Tax Assessment Tax Assessment Total Assessment is a certain percentage of the fair market value that is determined by local assessors to be the total taxable value of land and additions on the property. | Land | Improvement |
|---|---|---|---|---|
| 2024 | $5,654 | $20,186 | $4,129 | $16,057 |
| 2023 | $5,359 | $20,186 | $4,129 | $16,057 |
| 2022 | $5,359 | $20,186 | $4,129 | $16,057 |
| 2021 | $5,208 | $17,388 | $688 | $16,700 |
| 2020 | $5,155 | $17,388 | $688 | $16,700 |
| 2019 | $5,252 | $19,458 | $688 | $18,770 |
| 2018 | $4,196 | $14,934 | $550 | $14,384 |
| 2017 | $4,132 | $14,934 | $550 | $14,384 |
| 2016 | $4,149 | $14,934 | $550 | $14,384 |
| 2015 | $3,355 | $12,038 | $2,339 | $9,699 |
| 2014 | $3,291 | $12,038 | $2,339 | $9,699 |
| 2013 | $3,019 | $12,038 | $2,339 | $9,699 |
Source: Public Records
Map
Nearby Homes
- 1600 Brittany Ct Unit C-2
- 1500 Canbury Ct Unit 11373
- 10 Old Oak Dr Unit 103
- 51 Old Oak Dr Unit 414
- 586 Fairway View Dr Unit 1A
- 577 Fairway View Dr Unit 1J
- 588 Fairway View Dr Unit 2E
- 50 Lake Blvd Unit 632
- 100 Lake Blvd Unit 603
- 400 E Dundee Rd Unit 207C
- 10 Oak Creek Dr Unit 1020
- 8 Oak Creek Dr Unit 1803
- 7 Oak Creek Dr Unit 3703
- 250 Lake Blvd Unit 218
- 1242 Nova Ct Unit 24
- 150 Lake Blvd Unit 125
- 1239 Oboe Ct Unit 33
- 496 Raupp Blvd
- 416 Trinity Ct
- 36 Crestview Terrace
- 1606 Queens Ct Unit D1
- 1606 Queens Ct Unit 1443R
- 1606 Queens Ct Unit 1443R
- 1606 Queens Ct Unit 1443R
- 1606 Queens Ct Unit C1
- 1604 Queens Ct Unit 1443L
- 1604 Queens Ct Unit 1443L
- 1604 Queens Ct Unit 1443L
- 1604 Queens Ct Unit 1443L
- 1604 Queens Ct Unit A1
- 1604 Queens Ct Unit A2
- 1604 Queens Ct Unit B2
- 1600 Queens Ct Unit 1444L
- 1600 Queens Ct Unit 1444L
- 1600 Queens Ct Unit 1444L
- 1600 Queens Ct Unit 1444L
- 1602 Queens Ct Unit C-1
- 1602 Queens Ct Unit 1444R
- 1602 Queens Ct Unit 1444R
- 1602 Queens Ct Unit 1444R