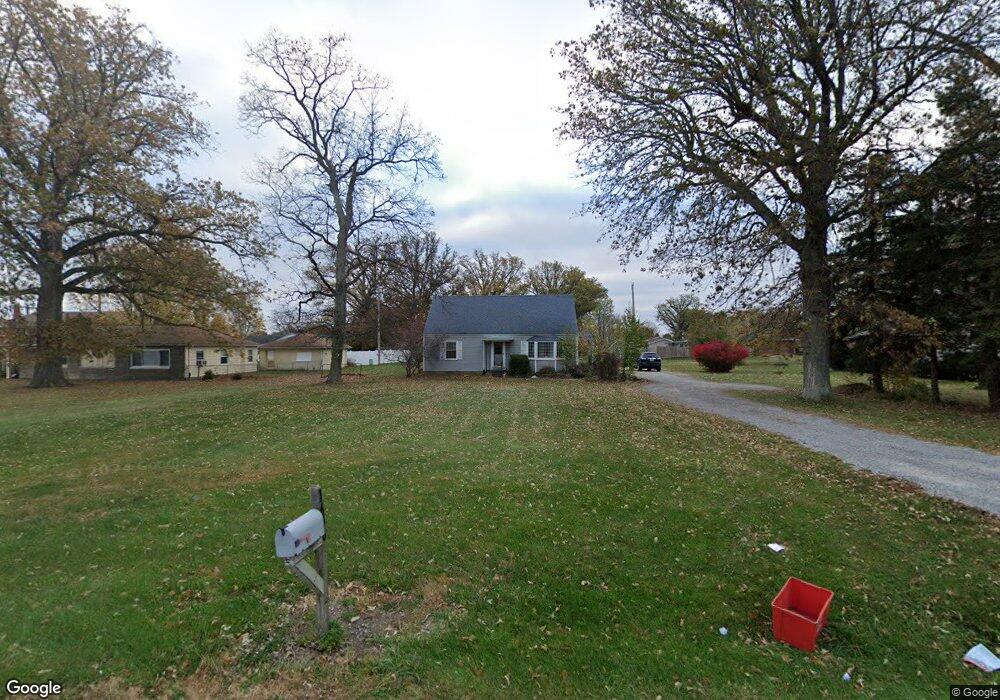
1606 State Route 501 Wapakoneta, OH 45895
Estimated Value: $331,000 - $370,000
5
Beds
2
Baths
2,384
Sq Ft
$150/Sq Ft
Est. Value
About This Home
This home is located at 1606 State Route 501, Wapakoneta, OH 45895 and is currently estimated at $357,148, approximately $149 per square foot. 1606 State Route 501 is a home located in Auglaize County with nearby schools including Wapakoneta Elementary School, Wapakoneta High School, and Wapakoneta Middle School.
Ownership History
Date
Name
Owned For
Owner Type
Purchase Details
Closed on
Oct 15, 2018
Sold by
Powell Jordan M and Powell Ashley L
Bought by
Herbst Abigail L and Herbst Jay
Current Estimated Value
Home Financials for this Owner
Home Financials are based on the most recent Mortgage that was taken out on this home.
Original Mortgage
$144,000
Outstanding Balance
$125,577
Interest Rate
4.5%
Mortgage Type
Purchase Money Mortgage
Estimated Equity
$231,571
Purchase Details
Closed on
Aug 7, 2015
Sold by
Wilmarth Kirk D
Bought by
Powell Jordan M and Powell Ashley L
Home Financials for this Owner
Home Financials are based on the most recent Mortgage that was taken out on this home.
Original Mortgage
$165,938
Interest Rate
3.87%
Mortgage Type
FHA
Purchase Details
Closed on
Oct 29, 1991
Sold by
Kennedy Thomas Perrin
Bought by
Shappell Robert Andrew
Create a Home Valuation Report for This Property
The Home Valuation Report is an in-depth analysis detailing your home's value as well as a comparison with similar homes in the area
Home Values in the Area
Average Home Value in this Area
Purchase History
| Date | Buyer | Sale Price | Title Company |
|---|---|---|---|
| Herbst Abigail L | $180,000 | Superior Title | |
| Powell Jordan M | $169,000 | Republic Title | |
| Shappell Robert Andrew | $74,000 | -- |
Source: Public Records
Mortgage History
| Date | Status | Borrower | Loan Amount |
|---|---|---|---|
| Open | Herbst Abigail L | $144,000 | |
| Closed | Powell Jordan M | $165,938 |
Source: Public Records
Tax History Compared to Growth
Tax History
| Year | Tax Paid | Tax Assessment Tax Assessment Total Assessment is a certain percentage of the fair market value that is determined by local assessors to be the total taxable value of land and additions on the property. | Land | Improvement |
|---|---|---|---|---|
| 2024 | $4,878 | $100,070 | $16,400 | $83,670 |
| 2023 | $1,616 | $100,070 | $16,400 | $83,670 |
| 2022 | $2,397 | $68,500 | $13,630 | $54,870 |
| 2021 | $2,378 | $68,500 | $13,630 | $54,870 |
| 2020 | $1,202 | $68,506 | $13,633 | $54,873 |
| 2019 | $2,036 | $56,155 | $11,176 | $44,979 |
| 2018 | $2,043 | $56,155 | $11,176 | $44,979 |
| 2017 | $2,032 | $56,155 | $11,176 | $44,979 |
| 2016 | $1,789 | $49,574 | $10,640 | $38,934 |
| 2015 | $1,765 | $49,574 | $10,640 | $38,934 |
| 2014 | $2,085 | $49,574 | $10,640 | $38,934 |
| 2013 | $1,279 | $27,017 | $10,640 | $16,377 |
Source: Public Records
Map
Nearby Homes
- 109 Bluegrass Dr
- 808 Aster Dr
- 322 Cole Dr
- 920 Primrose Dr
- 1028 Stonegate Ct
- 906 Aster Dr
- 1020 Timber Trail
- 420 Hoopengarner St
- 924 Poppy Dr
- 17054 State Route 198
- 0 Wapakoneta Cridersville Rd
- 601 Warren St
- 9 E Silver St
- 106 Valleyview Dr
- 414 W Auglaize St
- 307 W Auglaize St
- 0 Ohio 67
- 608 W Benton St
- 814 W Benton St
- 307 W Benton St
- 1606 Ohio 501
- 1604 State Route 501
- 415 Infirmary Rd
- 1602 State Route 501
- 410 Woodlawn Dr
- 1606 Springfield Ave
- 408 Woodlawn Dr
- 409 Infirmary Rd
- 1610 Springfield Ave
- 415 Woodlawn Dr
- 411 Woodlawn Dr
- 413 Woodlawn Dr
- 407 Infirmary Rd
- 406 Woodlawn Dr
- 1602 Springfield Ave
- 1614 Springfield Ave
- 409 Woodlawn Dr
- 404 Woodlawn Dr