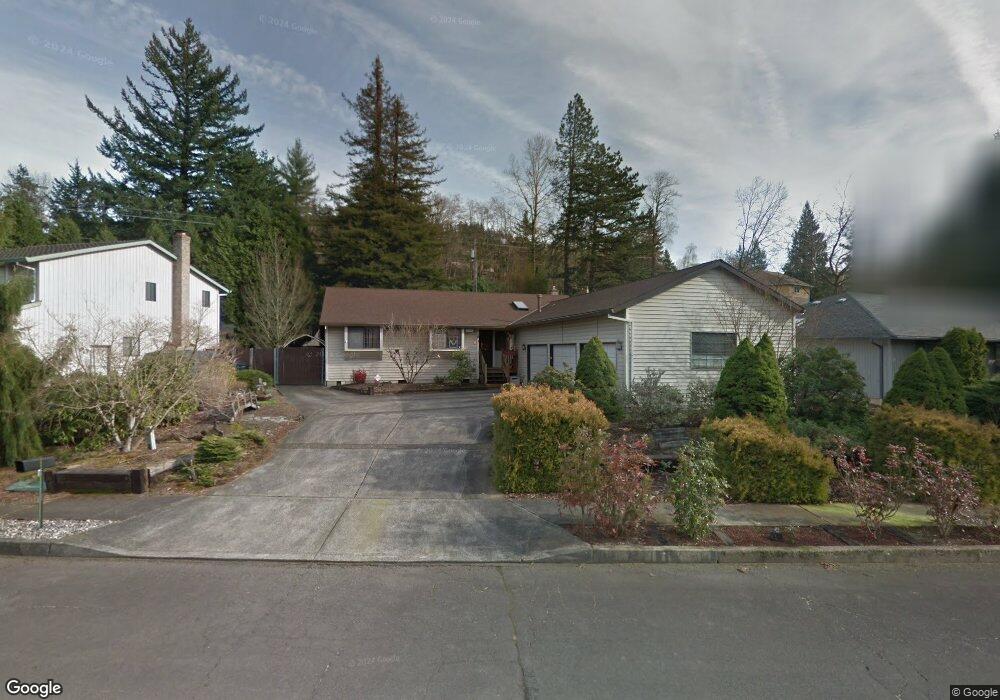
1606 SW 10th Ct Gresham, OR 97080
Gresham Butte NeighborhoodEstimated Value: $359,968 - $525,000
3
Beds
2
Baths
1,512
Sq Ft
$307/Sq Ft
Est. Value
About This Home
This home is located at 1606 SW 10th Ct, Gresham, OR 97080 and is currently estimated at $464,492, approximately $307 per square foot. 1606 SW 10th Ct is a home located in Multnomah County with nearby schools including Hollydale Elementary School, Dexter McCarty Middle School, and Gresham High School.
Ownership History
Date
Name
Owned For
Owner Type
Purchase Details
Closed on
Jan 24, 2024
Sold by
Parrish David L
Bought by
Holton Kimberly A
Current Estimated Value
Purchase Details
Closed on
Nov 14, 2023
Sold by
Blazier Jill Lynn
Bought by
Parrish David L
Purchase Details
Closed on
Dec 14, 2009
Sold by
Blazier James H
Bought by
Blazier James H and Blazier Jill L
Home Financials for this Owner
Home Financials are based on the most recent Mortgage that was taken out on this home.
Original Mortgage
$155,000
Interest Rate
4.91%
Mortgage Type
New Conventional
Purchase Details
Closed on
Jun 28, 1996
Sold by
Helms William F
Bought by
Blazier James H and Parrish Jill L
Home Financials for this Owner
Home Financials are based on the most recent Mortgage that was taken out on this home.
Original Mortgage
$120,500
Interest Rate
8.01%
Mortgage Type
Purchase Money Mortgage
Create a Home Valuation Report for This Property
The Home Valuation Report is an in-depth analysis detailing your home's value as well as a comparison with similar homes in the area
Home Values in the Area
Average Home Value in this Area
Purchase History
| Date | Buyer | Sale Price | Title Company |
|---|---|---|---|
| Holton Kimberly A | $246,000 | None Listed On Document | |
| Parrish David L | -- | None Listed On Document | |
| Blazier James H | -- | Lawyers Title Insurance Corp | |
| Blazier James H | $162,700 | Fidelity National Title Co |
Source: Public Records
Mortgage History
| Date | Status | Borrower | Loan Amount |
|---|---|---|---|
| Previous Owner | Blazier James H | $155,000 | |
| Previous Owner | Blazier James H | $120,500 |
Source: Public Records
Tax History
| Year | Tax Paid | Tax Assessment Tax Assessment Total Assessment is a certain percentage of the fair market value that is determined by local assessors to be the total taxable value of land and additions on the property. | Land | Improvement |
|---|---|---|---|---|
| 2025 | $5,830 | $286,480 | -- | -- |
| 2024 | $5,581 | $278,140 | -- | -- |
| 2023 | $5,084 | $270,040 | $0 | $0 |
| 2022 | $4,942 | $262,180 | $0 | $0 |
| 2021 | $4,818 | $254,550 | $0 | $0 |
| 2020 | $4,533 | $247,140 | $0 | $0 |
| 2019 | $4,414 | $239,950 | $0 | $0 |
| 2018 | $4,209 | $232,970 | $0 | $0 |
| 2017 | $4,039 | $226,190 | $0 | $0 |
| 2016 | $3,561 | $219,610 | $0 | $0 |
Source: Public Records
Map
Nearby Homes
- 1175 SW Chastain Dr
- 1960 SW 13th Ct
- 317 SW Angeline Ave
- 1434 SW 5th Place
- 1333 SW 5th Place
- 404 SW Riverview Ave
- 419 SW Day Ct
- 1333 SW 19th Dr
- 1421 SW Binford Lake Pkwy
- 638 SW 7th St
- 159 SW Florence Ave Unit 64
- 159 SW Florence Ave
- 2294 SW Wallula Ln
- 1441 SW 23rd Ct
- 200 SW Florence Ave
- 1113 W Powell Blvd
- 64 NW Florence Ave
- 21 NW Mawrcrest Ave
- 63 NW Mawrcrest Ave
- 1963 SW Myers Place
- 1618 SW 10th Ct
- 1530 SW 10th Ct
- 1533 SW 10th Ct
- 1624 SW 10th Ct
- 1601 SW 10th Ct
- 1527 SW 10th Ct
- 1061 SW Chastain Dr
- 1155 SW Towle Ave
- 1615 SW 10th Ct
- 1029 SW Chastain Dr
- 1087 SW Chastain Dr
- 1505 SW 10th Ct
- 1623 SW 10th Ct
- 1636 SW 10th Ct
- 1103 SW Chastain Dr
- 1020 SW Towle Ave
- 1640 SW 10th Ct
- 1635 SW 10th Ct
- 1040 SW Chastain Dr
- 1092 SW Chastain Dr
Your Personal Tour Guide
Ask me questions while you tour the home.