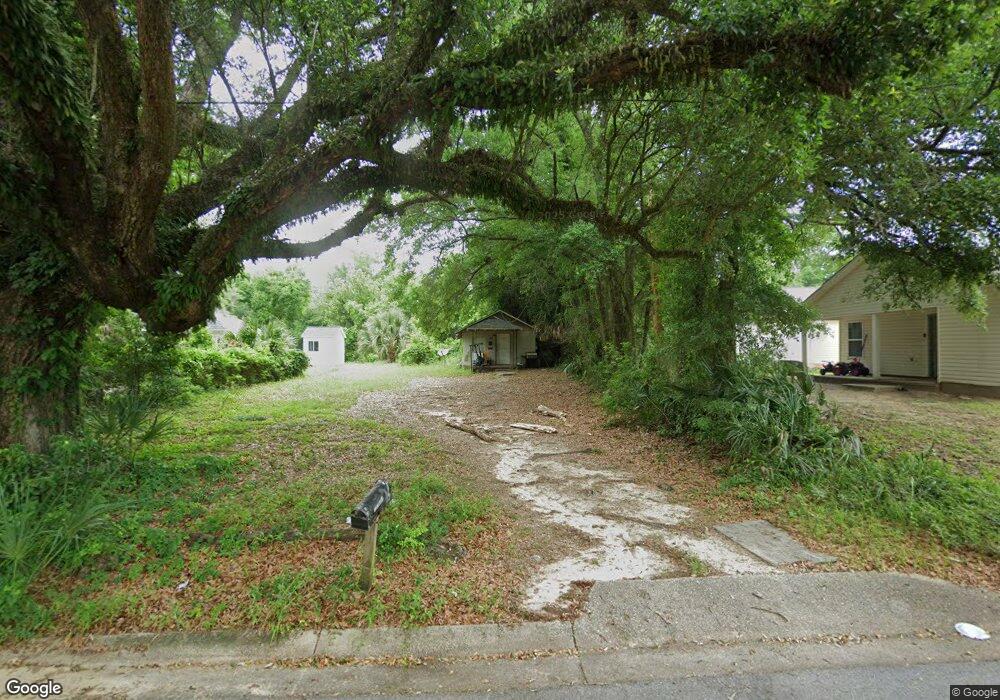
1606 W De Soto St Pensacola, FL 32501
Estimated Value: $48,038 - $146,000
--
Bed
1
Bath
570
Sq Ft
$160/Sq Ft
Est. Value
About This Home
This home is located at 1606 W De Soto St, Pensacola, FL 32501 and is currently estimated at $91,260, approximately $160 per square foot. 1606 W De Soto St is a home located in Escambia County with nearby schools including C.A. Weis Elementary School, Warrington Middle School, and Pensacola High School.
Ownership History
Date
Name
Owned For
Owner Type
Purchase Details
Closed on
Nov 17, 2010
Sold by
Trachy Harry O and Trachy Harry Oliver
Bought by
Ahl David
Current Estimated Value
Home Financials for this Owner
Home Financials are based on the most recent Mortgage that was taken out on this home.
Original Mortgage
$12,500
Outstanding Balance
$186
Interest Rate
4.2%
Mortgage Type
Seller Take Back
Estimated Equity
$91,074
Purchase Details
Closed on
Jun 8, 1999
Sold by
Trachy Harry O
Bought by
Patterson Trachy Harry Oliver and Patterson Trachy Patricia
Create a Home Valuation Report for This Property
The Home Valuation Report is an in-depth analysis detailing your home's value as well as a comparison with similar homes in the area
Home Values in the Area
Average Home Value in this Area
Purchase History
| Date | Buyer | Sale Price | Title Company |
|---|---|---|---|
| Ahl David | $12,500 | Accu Title Agency | |
| Patterson Trachy Harry Oliver | -- | -- |
Source: Public Records
Mortgage History
| Date | Status | Borrower | Loan Amount |
|---|---|---|---|
| Open | Ahl David | $12,500 |
Source: Public Records
Tax History Compared to Growth
Tax History
| Year | Tax Paid | Tax Assessment Tax Assessment Total Assessment is a certain percentage of the fair market value that is determined by local assessors to be the total taxable value of land and additions on the property. | Land | Improvement |
|---|---|---|---|---|
| 2024 | $648 | $44,929 | $10,675 | $34,254 |
| 2023 | $648 | $33,376 | $0 | $0 |
| 2022 | $600 | $39,608 | $10,675 | $28,933 |
| 2021 | $517 | $27,904 | $0 | $0 |
| 2020 | $464 | $25,077 | $0 | $0 |
| 2019 | $444 | $23,747 | $0 | $0 |
| 2018 | $425 | $22,332 | $0 | $0 |
| 2017 | $405 | $20,836 | $0 | $0 |
| 2016 | $401 | $20,336 | $0 | $0 |
| 2015 | $391 | $19,505 | $0 | $0 |
| 2014 | $378 | $18,665 | $0 | $0 |
Source: Public Records
Map
Nearby Homes