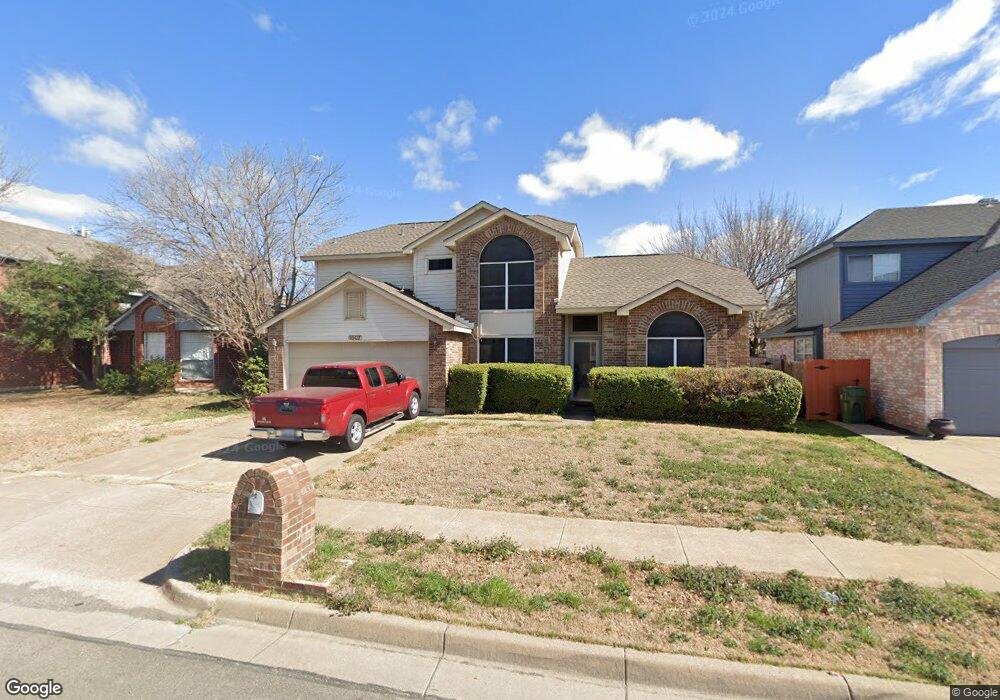
1607 Caplin Dr Arlington, TX 76018
South East Arlington NeighborhoodEstimated Value: $306,000 - $320,000
3
Beds
2
Baths
1,721
Sq Ft
$182/Sq Ft
Est. Value
About This Home
This home is located at 1607 Caplin Dr, Arlington, TX 76018 and is currently estimated at $313,806, approximately $182 per square foot. 1607 Caplin Dr is a home located in Tarrant County with nearby schools including Fitzgerald Elementary School, Ousley Jr. High School, and Bowie High School.
Ownership History
Date
Name
Owned For
Owner Type
Purchase Details
Closed on
Jul 23, 2002
Sold by
Vincent Danita Rochelle
Bought by
Vincent Roderick Glen
Current Estimated Value
Purchase Details
Closed on
Oct 26, 2000
Sold by
Hubbard Wes and Hubbard Nancy
Bought by
Vincent Roderick G and Vincent Danita
Home Financials for this Owner
Home Financials are based on the most recent Mortgage that was taken out on this home.
Original Mortgage
$100,300
Outstanding Balance
$46,268
Interest Rate
11.5%
Estimated Equity
$267,538
Purchase Details
Closed on
Jan 10, 1996
Sold by
Hud
Bought by
Hubbard Wes and Hubbard Nancy
Home Financials for this Owner
Home Financials are based on the most recent Mortgage that was taken out on this home.
Original Mortgage
$96,626
Interest Rate
7.14%
Mortgage Type
FHA
Purchase Details
Closed on
Sep 1, 1995
Sold by
First Union Mtg Corp
Bought by
Hud
Purchase Details
Closed on
Jun 6, 1995
Sold by
Armistead Rick Ashley and Armistead Diana Longley
Bought by
First Union Mtg Corp
Create a Home Valuation Report for This Property
The Home Valuation Report is an in-depth analysis detailing your home's value as well as a comparison with similar homes in the area
Home Values in the Area
Average Home Value in this Area
Purchase History
| Date | Buyer | Sale Price | Title Company |
|---|---|---|---|
| Vincent Roderick Glen | -- | -- | |
| Vincent Roderick G | -- | -- | |
| Hubbard Wes | $95,000 | -- | |
| Hud | -- | -- | |
| First Union Mtg Corp | $98,669 | -- |
Source: Public Records
Mortgage History
| Date | Status | Borrower | Loan Amount |
|---|---|---|---|
| Open | Vincent Roderick G | $100,300 | |
| Previous Owner | Hubbard Wes | $96,626 | |
| Closed | Vincent Roderick G | $11,800 | |
| Closed | Vincent Roderick Glen | $0 |
Source: Public Records
Tax History Compared to Growth
Tax History
| Year | Tax Paid | Tax Assessment Tax Assessment Total Assessment is a certain percentage of the fair market value that is determined by local assessors to be the total taxable value of land and additions on the property. | Land | Improvement |
|---|---|---|---|---|
| 2025 | $3,751 | $313,502 | $65,079 | $248,423 |
| 2024 | $3,751 | $313,502 | $65,079 | $248,423 |
| 2023 | $4,896 | $310,712 | $40,000 | $270,712 |
| 2022 | $5,016 | $255,450 | $40,000 | $215,450 |
| 2021 | $4,764 | $225,731 | $40,000 | $185,731 |
| 2020 | $4,186 | $208,847 | $40,000 | $168,847 |
| 2019 | $3,937 | $210,136 | $40,000 | $170,136 |
| 2018 | $3,062 | $137,759 | $17,000 | $120,759 |
| 2017 | $3,333 | $168,500 | $17,000 | $151,500 |
| 2016 | $3,030 | $144,532 | $17,000 | $127,532 |
| 2015 | $2,393 | $103,500 | $17,000 | $86,500 |
| 2014 | $2,393 | $103,500 | $17,000 | $86,500 |
Source: Public Records
Map
Nearby Homes
- 1611 Caplin Dr
- 1604 Barclay Dr
- 5114 Creek Valley Dr
- 1712 Rockdale Dr
- 1426 Woodfern Dr
- 5008 Redwater Dr
- 1416 Woodfern Dr
- 1609 Country Ln
- 4756 Hollow Tree Dr
- 1408 Bandera Dr
- 1433 Spring Willow Dr
- 5326 Creek Valley Dr
- 5400 Creek Valley Dr
- 1718 Gentle Wind Dr
- 1405 Mapleton Ct
- 1405 Glenwillow Dr
- 4 Delano Dr
- 10 Delano Ct
- 11 Delano Ct
- 5 Delano Dr
- 1609 Caplin Dr
- 1605 Caplin Dr
- 1603 Caplin Dr
- 5000 Creek Valley Dr
- 1615 Caplin Dr
- 1601 Caplin Dr
- 4922 Highbank Dr
- 1612 Caplin Dr
- 4920 Highbank Dr
- 4924 Highbank Dr
- 5002 Creek Valley Dr
- 1617 Caplin Dr
- 4918 Highbank Dr
- 4926 Highbank Dr
- 4916 Highbank Dr
- 4928 Highbank Dr
- 1618 Caplin Dr
- 4914 Highbank Dr
- 5004 Creek Valley Dr
- 1619 Caplin Dr