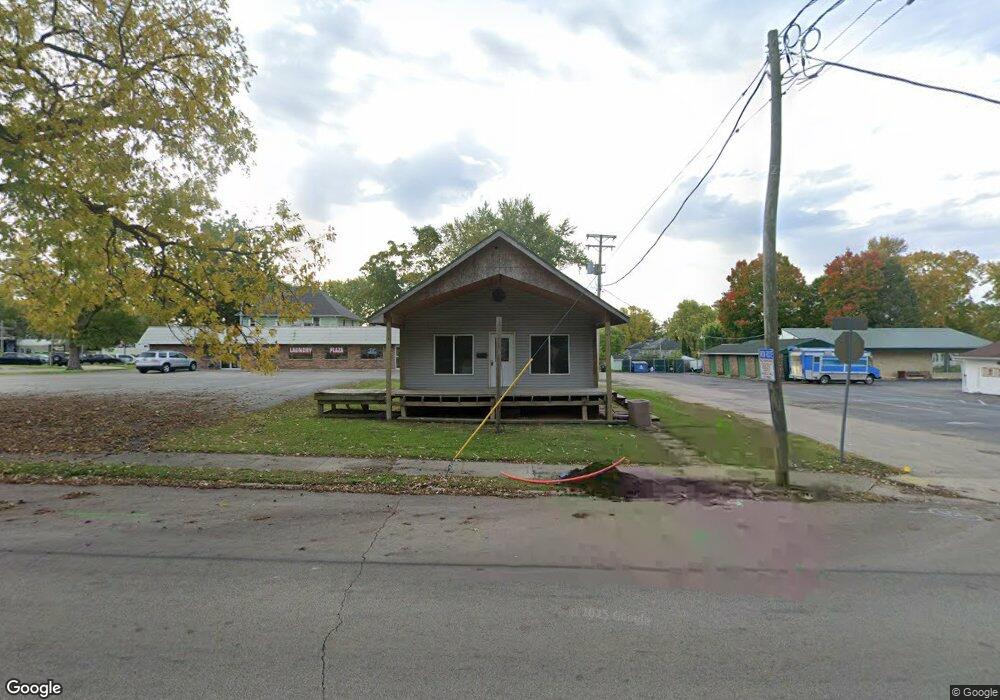
1607 E 4th St Sterling, IL 61081
Estimated Value: $45,079
Studio
--
Bath
894
Sq Ft
$50/Sq Ft
Est. Value
About This Home
This home is located at 1607 E 4th St, Sterling, IL 61081 and is currently estimated at $45,079, approximately $50 per square foot. 1607 E 4th St is a home located in Whiteside County with nearby schools including Christ Lutheran School.
Ownership History
Date
Name
Owned For
Owner Type
Purchase Details
Closed on
Jul 28, 2020
Sold by
Montanez Ricardo and Montanez Seng Y
Bought by
Baker Eric C
Current Estimated Value
Purchase Details
Closed on
May 8, 2009
Sold by
Wolford George Grant and Wolford Terry L
Bought by
Montanez Ricardo and Montanez Seng Yang
Home Financials for this Owner
Home Financials are based on the most recent Mortgage that was taken out on this home.
Original Mortgage
$18,500
Interest Rate
4.83%
Mortgage Type
Future Advance Clause Open End Mortgage
Create a Home Valuation Report for This Property
The Home Valuation Report is an in-depth analysis detailing your home's value as well as a comparison with similar homes in the area
Home Values in the Area
Average Home Value in this Area
Purchase History
| Date | Buyer | Sale Price | Title Company |
|---|---|---|---|
| Baker Eric C | $30,000 | None Available | |
| Montanez Ricardo | $4,500 | None Available | |
| Montanez Ricardo | $15,500 | None Available |
Source: Public Records
Mortgage History
| Date | Status | Borrower | Loan Amount |
|---|---|---|---|
| Previous Owner | Montanez Ricardo | $18,500 |
Source: Public Records
Tax History
| Year | Tax Paid | Tax Assessment Tax Assessment Total Assessment is a certain percentage of the fair market value that is determined by local assessors to be the total taxable value of land and additions on the property. | Land | Improvement |
|---|---|---|---|---|
| 2024 | $1,268 | $12,162 | $1,175 | $10,987 |
| 2023 | $1,275 | $12,162 | $1,175 | $10,987 |
| 2022 | $1,300 | $12,162 | $1,175 | $10,987 |
| 2021 | $1,330 | $12,162 | $1,175 | $10,987 |
| 2020 | $1,340 | $12,162 | $1,175 | $10,987 |
| 2019 | $993 | $8,908 | $1,175 | $7,733 |
| 2018 | $982 | $8,922 | $1,177 | $7,745 |
| 2017 | $984 | $8,861 | $1,169 | $7,692 |
| 2016 | $959 | $8,575 | $1,131 | $7,444 |
| 2015 | $917 | $8,811 | $1,162 | $7,649 |
| 2014 | $915 | $8,615 | $1,136 | $7,479 |
| 2013 | $917 | $8,811 | $1,162 | $7,649 |
Source: Public Records
Map
Nearby Homes
- 203 17th Ave
- 612 15th Ave
- 510 12th Ave
- 0 E 4th St
- 1212 12th Ave
- 802 E 5th St
- 1005 8th Ave
- 1307 Sinnissippi Park Rd
- Lot 4 E 19th St
- Lot 1 E 19th St
- 710 E 16th St
- 2912 Woodlawn Rd
- 109 6th Ave
- 226 Avenue F
- 1905 E 23rd St
- 313 Kloss St
- 905 E 21st St
- 312 E 11th St
- Lot 403 E 21st St
- 1310 Mineral Springs Rd
Your Personal Tour Guide
Ask me questions while you tour the home.