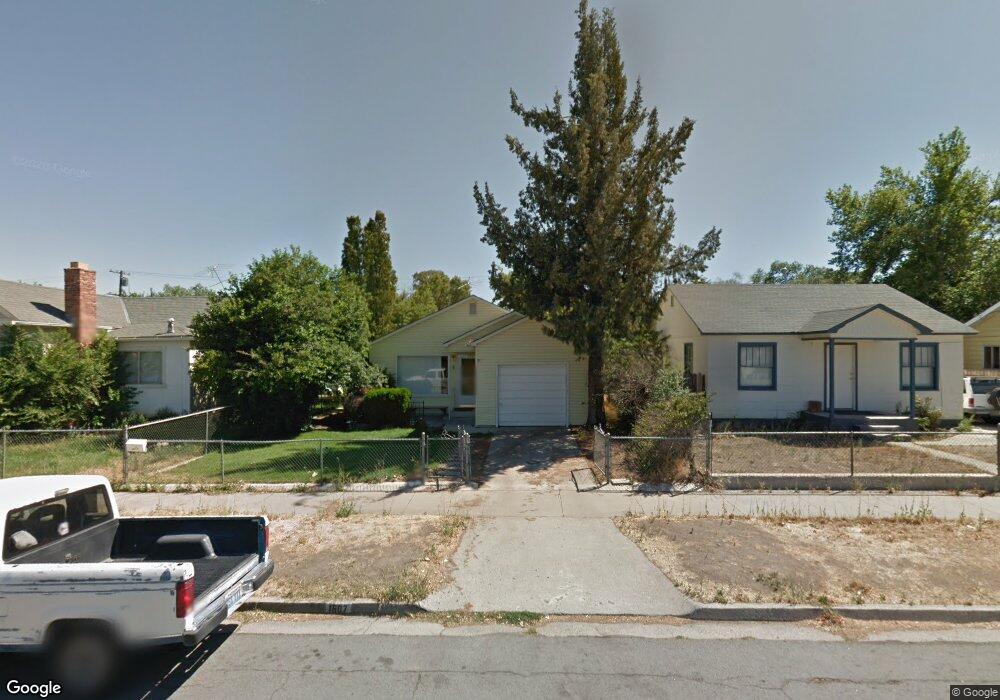
1607 H St Unit H Sparks, NV 89431
Downtown Sparks NeighborhoodEstimated Value: $411,197 - $498,000
3
Beds
2
Baths
1,279
Sq Ft
$360/Sq Ft
Est. Value
About This Home
This home is located at 1607 H St Unit H, Sparks, NV 89431 and is currently estimated at $460,299, approximately $359 per square foot. 1607 H St Unit H is a home located in Washoe County with nearby schools including Robert Mitchell Elementary School, Sparks Middle School, and Sparks High School.
Ownership History
Date
Name
Owned For
Owner Type
Purchase Details
Closed on
Jun 14, 2022
Sold by
6Ten Properties Llc
Bought by
High Sierra Properties Llc
Current Estimated Value
Purchase Details
Closed on
Sep 6, 2019
Sold by
Salvato Aldo J
Bought by
6Ten Properties Llc
Home Financials for this Owner
Home Financials are based on the most recent Mortgage that was taken out on this home.
Original Mortgage
$200,000
Interest Rate
3.7%
Mortgage Type
Commercial
Purchase Details
Closed on
Apr 16, 2016
Sold by
Ferguson William M and Ferguson Vicki A
Bought by
Salvato Aldo
Home Financials for this Owner
Home Financials are based on the most recent Mortgage that was taken out on this home.
Original Mortgage
$176,739
Interest Rate
4.25%
Mortgage Type
FHA
Purchase Details
Closed on
Jan 28, 2004
Sold by
Angle Ernestine J
Bought by
Ferguson William M and Ferguson Vicki A
Create a Home Valuation Report for This Property
The Home Valuation Report is an in-depth analysis detailing your home's value as well as a comparison with similar homes in the area
Home Values in the Area
Average Home Value in this Area
Purchase History
| Date | Buyer | Sale Price | Title Company |
|---|---|---|---|
| High Sierra Properties Llc | $465,500 | Stewart Title | |
| 6Ten Properties Llc | $244,000 | Etrco | |
| Salvato Aldo | $180,000 | Ticor Title Reno Main | |
| Ferguson William M | $175,000 | First American Title |
Source: Public Records
Mortgage History
| Date | Status | Borrower | Loan Amount |
|---|---|---|---|
| Previous Owner | 6Ten Properties Llc | $200,000 | |
| Previous Owner | Salvato Aldo | $176,739 |
Source: Public Records
Tax History Compared to Growth
Tax History
| Year | Tax Paid | Tax Assessment Tax Assessment Total Assessment is a certain percentage of the fair market value that is determined by local assessors to be the total taxable value of land and additions on the property. | Land | Improvement |
|---|---|---|---|---|
| 2025 | $1,013 | $58,530 | $39,634 | $18,896 |
| 2024 | $1,013 | $55,021 | $36,775 | $18,246 |
| 2023 | $2,117 | $54,233 | $37,340 | $16,893 |
| 2022 | $870 | $45,038 | $31,222 | $13,817 |
| 2021 | $805 | $37,554 | $24,106 | $13,448 |
| 2020 | $756 | $38,133 | $24,938 | $13,195 |
| 2019 | $722 | $33,830 | $21,347 | $12,483 |
| 2018 | $688 | $26,406 | $14,431 | $11,975 |
| 2017 | $660 | $25,058 | $13,300 | $11,758 |
| 2016 | $646 | $22,433 | $10,640 | $11,793 |
| 2015 | $166 | $19,296 | $7,648 | $11,648 |
| 2014 | $630 | $17,634 | $6,650 | $10,984 |
| 2013 | -- | $16,616 | $5,852 | $10,764 |
Source: Public Records
Map
Nearby Homes