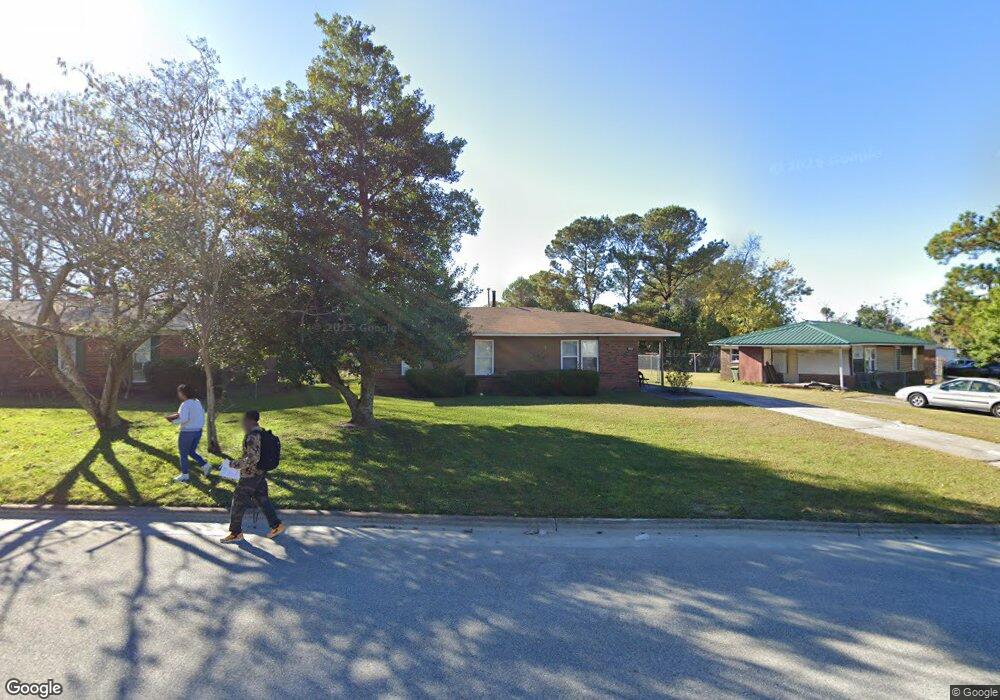
1607 Kornegay Ave Wilmington, NC 28405
Estimated Value: $152,000 - $234,000
3
Beds
1
Bath
1,040
Sq Ft
$198/Sq Ft
Est. Value
About This Home
This home is located at 1607 Kornegay Ave, Wilmington, NC 28405 and is currently estimated at $206,233, approximately $198 per square foot. 1607 Kornegay Ave is a home located in New Hanover County with nearby schools including Wrightsboro Elementary School, Williston Middle School, and Emsley A. Laney High School.
Ownership History
Date
Name
Owned For
Owner Type
Purchase Details
Closed on
Mar 28, 2002
Sold by
Wilmington Housing Fin/Dev Inc
Bought by
Webb Larry Lenora
Current Estimated Value
Purchase Details
Closed on
Jun 20, 1996
Sold by
Secretary Of Hud
Bought by
Wilm Housing Fin/Dev Inc
Purchase Details
Closed on
Mar 26, 1996
Sold by
Craig David B Sub Trustee
Bought by
Secretary Of Hud
Purchase Details
Closed on
Jan 3, 1995
Sold by
Boone William E
Bought by
Boone William E Hrs
Purchase Details
Closed on
May 10, 1994
Sold by
Boyd Fred W
Bought by
Boone William E
Purchase Details
Closed on
Mar 13, 1990
Sold by
Baggett Joseph A Carnalia
Bought by
Boone William E
Purchase Details
Closed on
May 1, 1988
Sold by
Mcmillan Franklin Mary S
Bought by
Baggett Joseph A Carnalia
Purchase Details
Closed on
Apr 1, 1988
Sold by
Mcmillan Franklin Mary S
Bought by
Mcmillan Franklin Mary S
Purchase Details
Closed on
Feb 1, 1986
Sold by
Housing Authority
Bought by
Mcmillan Franklin Mary S
Create a Home Valuation Report for This Property
The Home Valuation Report is an in-depth analysis detailing your home's value as well as a comparison with similar homes in the area
Home Values in the Area
Average Home Value in this Area
Purchase History
| Date | Buyer | Sale Price | Title Company |
|---|---|---|---|
| Webb Larry Lenora | $57,000 | -- | |
| Wilm Housing Fin/Dev Inc | -- | -- | |
| Secretary Of Hud | $42,000 | -- | |
| Boone William E Hrs | -- | -- | |
| Boone William E | -- | -- | |
| Boone William E | $39,000 | -- | |
| Baggett Joseph A Carnalia | $25,000 | -- | |
| Mcmillan Franklin Mary S | $16,000 | -- | |
| Mcmillan Franklin Mary S | -- | -- |
Source: Public Records
Tax History Compared to Growth
Tax History
| Year | Tax Paid | Tax Assessment Tax Assessment Total Assessment is a certain percentage of the fair market value that is determined by local assessors to be the total taxable value of land and additions on the property. | Land | Improvement |
|---|---|---|---|---|
| 2025 | $1,192 | $202,600 | $45,700 | $156,900 |
| 2023 | $1,094 | $125,700 | $52,600 | $73,100 |
| 2022 | $1,068 | $125,700 | $52,600 | $73,100 |
| 2021 | $1,076 | $125,700 | $52,600 | $73,100 |
| 2020 | $686 | $65,100 | $22,500 | $42,600 |
| 2019 | $686 | $65,100 | $22,500 | $42,600 |
| 2018 | $686 | $65,100 | $22,500 | $42,600 |
| 2017 | $686 | $65,100 | $22,500 | $42,600 |
| 2016 | $802 | $72,400 | $27,000 | $45,400 |
| 2015 | $767 | $72,400 | $27,000 | $45,400 |
| 2014 | $734 | $72,400 | $27,000 | $45,400 |
Source: Public Records
Map
Nearby Homes
- 1604 Kornegay Ave
- 1602 Forbes Ct
- 2603 McClammy St
- 1101 Emory St
- 431 Evans St
- 431-A Evans
- 468 Maides Ave
- 464 Maides Ave
- 460 Maides Ave
- 421 Evans St
- 437 Maides Ave
- 607 Sharease Cir
- 2926 Princess Place Dr
- 2402 Belvedere Dr
- 109 & 113 Clay St
- 222 Evans St
- 2113 Shirley Rd
- 110 Clay St
- 17 Montgomery Ave
- 2212 Brandon Rd
- 1611 Kornegay Ave
- 1605 Kornegay Ave
- 1603 Kornegay Ave
- 1617 Kornegay Ave
- 1603 Forbes Ct
- 1608 Kornegay Ave
- 1605 Forbes Ct
- 1623 Kornegay Ave
- 2707 Bunche St
- 1606 Kornegay Ave
- 1610 Kornegay Ave
- 1601 Kornegay Ave
- 2705 Bunche St
- 1612 Kornegay Ave
- 1601 Forbes Ct
- 2703 Bunche St
- 1602 Kornegay Ave
- 1606 Forbes Ct
- 1506 Kornegay Ave
- 2710 Bunche St