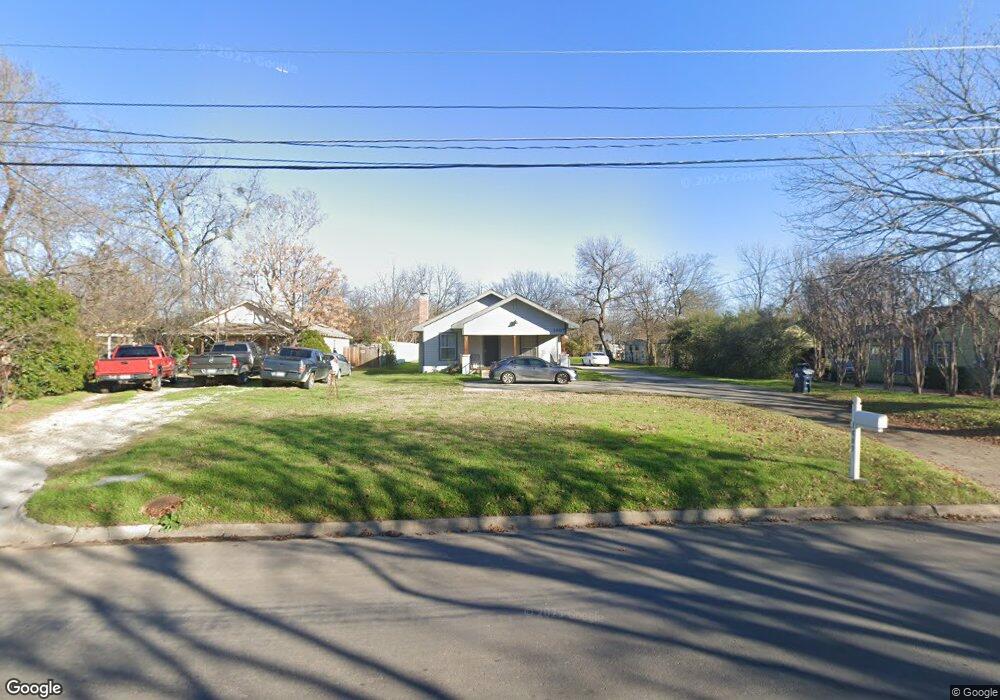
1607 Mccormick St Denton, TX 76205
Denia NeighborhoodEstimated Value: $321,000 - $348,000
5
Beds
3
Baths
1,792
Sq Ft
$186/Sq Ft
Est. Value
About This Home
This home is located at 1607 Mccormick St, Denton, TX 76205 and is currently estimated at $334,025, approximately $186 per square foot. 1607 Mccormick St is a home located in Denton County with nearby schools including Borman Elementary School, McMath Middle School, and Denton High School.
Ownership History
Date
Name
Owned For
Owner Type
Purchase Details
Closed on
May 27, 2021
Sold by
Sonata Llc
Bought by
Anderson Timothy J
Current Estimated Value
Purchase Details
Closed on
May 5, 2006
Sold by
Krause Jean Ann
Bought by
Quan Lawrence and Quan David Lawrence
Home Financials for this Owner
Home Financials are based on the most recent Mortgage that was taken out on this home.
Original Mortgage
$78,000
Interest Rate
6.25%
Mortgage Type
Purchase Money Mortgage
Purchase Details
Closed on
Apr 14, 1994
Sold by
Rankin James Leon and Rankin Margaret L
Bought by
Yarbrough J L
Home Financials for this Owner
Home Financials are based on the most recent Mortgage that was taken out on this home.
Original Mortgage
$10,000
Interest Rate
7.49%
Create a Home Valuation Report for This Property
The Home Valuation Report is an in-depth analysis detailing your home's value as well as a comparison with similar homes in the area
Home Values in the Area
Average Home Value in this Area
Purchase History
| Date | Buyer | Sale Price | Title Company |
|---|---|---|---|
| Anderson Timothy J | -- | Providence Title Company | |
| Quan Lawrence | -- | Paxton Pratt Title Lp | |
| Yarbrough J L | -- | -- |
Source: Public Records
Mortgage History
| Date | Status | Borrower | Loan Amount |
|---|---|---|---|
| Previous Owner | Quan Lawrence | $78,000 | |
| Previous Owner | Yarbrough J L | $10,000 |
Source: Public Records
Tax History Compared to Growth
Tax History
| Year | Tax Paid | Tax Assessment Tax Assessment Total Assessment is a certain percentage of the fair market value that is determined by local assessors to be the total taxable value of land and additions on the property. | Land | Improvement |
|---|---|---|---|---|
| 2025 | $4,845 | $264,000 | $109,361 | $154,639 |
| 2024 | $4,845 | $251,000 | $109,361 | $141,639 |
| 2023 | $5,251 | $275,000 | $109,361 | $165,639 |
| 2022 | $5,010 | $236,000 | $78,983 | $157,017 |
| 2021 | $3,274 | $147,261 | $38,276 | $108,985 |
| 2020 | $3,726 | $163,000 | $55,516 | $107,484 |
| 2019 | $4,199 | $176,000 | $55,516 | $120,484 |
| 2018 | $3,884 | $160,766 | $50,901 | $109,865 |
| 2017 | $3,337 | $135,000 | $39,589 | $95,411 |
| 2016 | $3,183 | $128,794 | $39,589 | $89,205 |
| 2015 | $2,996 | $118,777 | $39,589 | $79,188 |
| 2014 | $2,996 | $119,763 | $39,589 | $80,174 |
| 2013 | -- | $104,843 | $39,589 | $65,254 |
Source: Public Records
Map
Nearby Homes
- 1523 Oakwood Dr
- 1619 Mccormick St
- 1211 Lindsey St
- 1618 Kendolph Dr
- 1024 Greenlee St
- 2302 Mercedes Rd
- 631 Acme St
- 2216 Redwing Dr
- 2216 Ruff Rd
- 2314 Leslie St
- 1211 Kendolph Dr
- 1115 Mccormick St
- 1311 Margie St Unit 1&2
- 2421 Mercedes Rd
- 2321 Ruff Rd
- PARROT Plan at Eagle Creek
- LARK Plan at Eagle Creek
- ROBIN Plan at Eagle Creek
- Texas Mockingbird Plan at Eagle Creek
- Kingbird Plan at Eagle Creek
- 1605 Mccormick St
- 1613 Mccormick St
- 1310 Oakwood Dr
- 1603 Mccormick St
- 1315 Lindsey St
- 1307 Lindsey St
- 1306 Oakwood Dr
- 1402 Oakwood Dr
- 1600 Mccormick St
- 1608 Mccormick St
- 1302 Oakwood Dr
- 1305 Lindsey St
- 1703 Mccormick St
- 1406 Oakwood Dr
- 1411 Lindsey St
- 1702 Westwood Dr
- 1218 Oakwood Dr
- 1707 Mccormick St
- 1530 Mccormick St
- 1415 Lindsey St