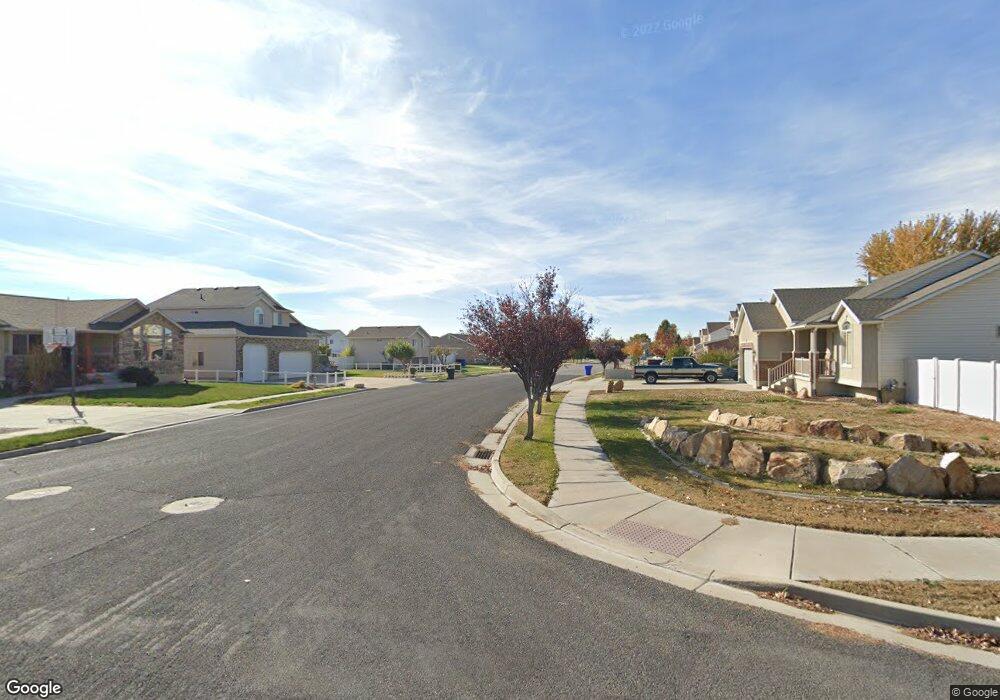
1607 N 1600 W Clearfield, UT 84015
Estimated Value: $430,000 - $461,000
5
Beds
2
Baths
2,102
Sq Ft
$210/Sq Ft
Est. Value
About This Home
This home is located at 1607 N 1600 W, Clearfield, UT 84015 and is currently estimated at $441,813, approximately $210 per square foot. 1607 N 1600 W is a home located in Davis County with nearby schools including Clinton Elementary School, Sunset Junior High School, and Clearfield High School.
Ownership History
Date
Name
Owned For
Owner Type
Purchase Details
Closed on
Oct 16, 2020
Sold by
Robinson Jack P and Robinson Brickale
Bought by
Barker Jeremy Lee and Barker Darcy
Current Estimated Value
Home Financials for this Owner
Home Financials are based on the most recent Mortgage that was taken out on this home.
Original Mortgage
$256,000
Outstanding Balance
$226,239
Interest Rate
2.8%
Mortgage Type
New Conventional
Estimated Equity
$215,574
Purchase Details
Closed on
Aug 28, 2018
Sold by
Stoker Lisa C
Bought by
Robinson Jack P and Robinson Brickale
Home Financials for this Owner
Home Financials are based on the most recent Mortgage that was taken out on this home.
Original Mortgage
$245,471
Interest Rate
4.6%
Mortgage Type
FHA
Purchase Details
Closed on
Sep 27, 1999
Sold by
Stoker Kenneth W and Stoker Lisa C
Bought by
Stoker Lisa C
Create a Home Valuation Report for This Property
The Home Valuation Report is an in-depth analysis detailing your home's value as well as a comparison with similar homes in the area
Home Values in the Area
Average Home Value in this Area
Purchase History
| Date | Buyer | Sale Price | Title Company |
|---|---|---|---|
| Barker Jeremy Lee | -- | Real Advantage Ttl Ins Agcy | |
| Robinson Jack P | -- | Backman Title | |
| Stoker Lisa C | -- | Inwest Title Services Inc |
Source: Public Records
Mortgage History
| Date | Status | Borrower | Loan Amount |
|---|---|---|---|
| Open | Barker Jeremy Lee | $256,000 | |
| Previous Owner | Robinson Jack P | $245,471 | |
| Previous Owner | Robinson Jack P | $13,800 |
Source: Public Records
Tax History Compared to Growth
Tax History
| Year | Tax Paid | Tax Assessment Tax Assessment Total Assessment is a certain percentage of the fair market value that is determined by local assessors to be the total taxable value of land and additions on the property. | Land | Improvement |
|---|---|---|---|---|
| 2025 | $2,299 | $221,100 | $79,740 | $141,360 |
| 2024 | $2,253 | $217,800 | $87,344 | $130,456 |
| 2023 | $2,069 | $370,000 | $117,547 | $252,453 |
| 2022 | $2,224 | $220,000 | $71,130 | $148,870 |
| 2021 | $2,064 | $303,000 | $90,356 | $212,644 |
| 2020 | $1,659 | $241,000 | $77,478 | $163,522 |
| 2019 | $1,607 | $228,000 | $89,243 | $138,757 |
| 2018 | $1,356 | $189,000 | $75,210 | $113,790 |
| 2016 | $1,183 | $85,195 | $29,433 | $55,762 |
| 2015 | $1,111 | $76,010 | $29,433 | $46,577 |
| 2014 | $1,005 | $69,894 | $29,433 | $40,461 |
| 2013 | -- | $72,402 | $25,230 | $47,172 |
Source: Public Records
Map
Nearby Homes