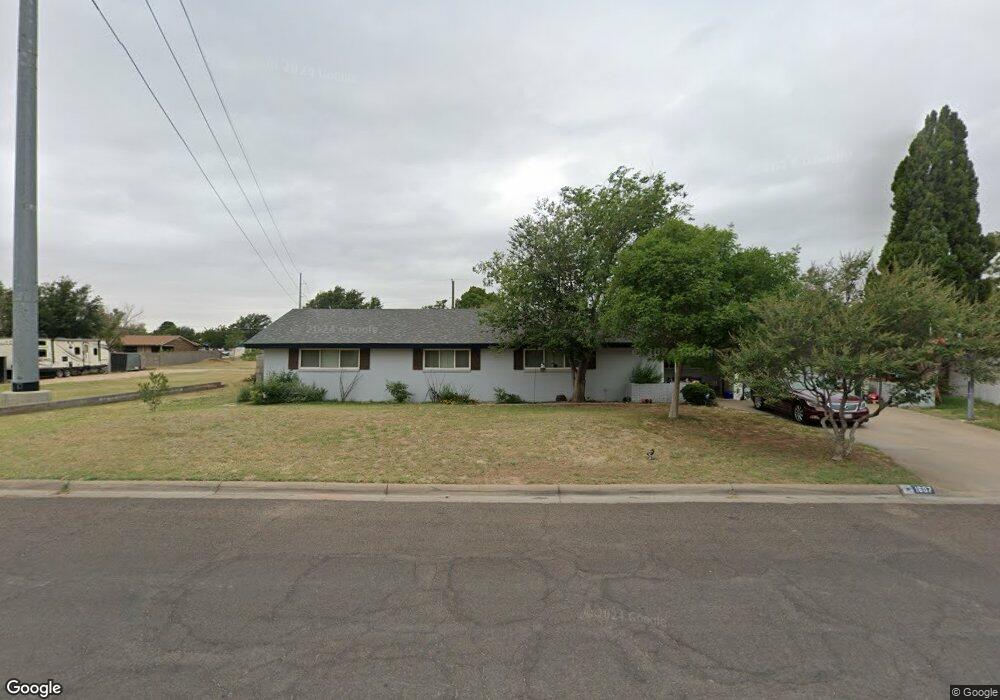
1607 N N St Midland, TX 79701
Estimated Value: $321,199 - $479,000
--
Bed
2
Baths
1,848
Sq Ft
$207/Sq Ft
Est. Value
About This Home
This home is located at 1607 N N St, Midland, TX 79701 and is currently estimated at $381,800, approximately $206 per square foot. 1607 N N St is a home located in Midland County with nearby schools including Midland High School, Sam Houston Collegiate Preparatory Elementary School, and First Baptist Child Development Center.
Ownership History
Date
Name
Owned For
Owner Type
Purchase Details
Closed on
Mar 30, 2012
Sold by
Rathjen Brenda
Bought by
Marston David Douglas and Marston Sarah Pruitt
Current Estimated Value
Home Financials for this Owner
Home Financials are based on the most recent Mortgage that was taken out on this home.
Original Mortgage
$158,721
Outstanding Balance
$109,238
Interest Rate
3.91%
Mortgage Type
FHA
Estimated Equity
$272,562
Purchase Details
Closed on
Feb 19, 2009
Sold by
Hunt B J and Hunt Wynell
Bought by
Rathjen Brenda
Purchase Details
Closed on
Oct 27, 1997
Bought by
Marston David Douglas
Purchase Details
Closed on
Jun 1, 1997
Bought by
Marston David Douglas
Purchase Details
Closed on
Jun 6, 1978
Bought by
Marston David Douglas
Create a Home Valuation Report for This Property
The Home Valuation Report is an in-depth analysis detailing your home's value as well as a comparison with similar homes in the area
Home Values in the Area
Average Home Value in this Area
Purchase History
| Date | Buyer | Sale Price | Title Company |
|---|---|---|---|
| Marston David Douglas | -- | West Texas Abstract | |
| Marston David Douglas | -- | West Texas Abstract & Title | |
| Rathjen Brenda | -- | Lone Star Abstract & Title C | |
| Marston David Douglas | -- | -- | |
| Marston David Douglas | -- | -- | |
| Marston David Douglas | -- | -- |
Source: Public Records
Mortgage History
| Date | Status | Borrower | Loan Amount |
|---|---|---|---|
| Open | Marston David Douglas | $158,721 | |
| Closed | Marston David Douglas | $158,721 |
Source: Public Records
Tax History Compared to Growth
Tax History
| Year | Tax Paid | Tax Assessment Tax Assessment Total Assessment is a certain percentage of the fair market value that is determined by local assessors to be the total taxable value of land and additions on the property. | Land | Improvement |
|---|---|---|---|---|
| 2025 | $3,742 | $227,480 | $37,340 | $190,140 |
| 2024 | $3,747 | $261,760 | $37,340 | $224,420 |
| 2023 | $3,081 | $205,620 | $37,340 | $168,280 |
| 2022 | $3,459 | $221,380 | $37,340 | $184,040 |
| 2021 | $3,732 | $214,190 | $37,340 | $176,850 |
| 2020 | $3,499 | $205,100 | $37,340 | $167,760 |
| 2019 | $3,883 | $205,100 | $37,340 | $167,760 |
| 2018 | $3,612 | $185,750 | $37,340 | $148,410 |
| 2017 | $3,572 | $183,710 | $37,340 | $146,370 |
| 2016 | $3,579 | $183,730 | $37,340 | $146,390 |
| 2015 | -- | $166,670 | $37,340 | $129,330 |
| 2014 | -- | $162,040 | $0 | $0 |
Source: Public Records
Map
Nearby Homes
- 1604 N N St
- 6716 S County Road 1160 Unit A
- 2207 Boyd Ave
- 2011 Community Ln
- 2003 Community Ln
- 1608 N L St
- 2300 W Golf Course Rd
- 1901 N Garfield St
- 2203 Princeton Ave
- 2008 Harvard Ave
- 1607 Shell Ave
- 1605 Shell Ave
- 1606 Shell Ave
- 1605 N I St
- 1426 Lanham St
- 2008 Bedford Dr
- 2208 Bedford Dr
- 1422 Lanham St
- 1501 Bedford Dr
- 2009 Bedford Dr
- 2201 W Golf Course Rd
- 1606 Hodges St
- 1605 N N St
- 1604 Hodges St
- 1612 Hodges St
- 1608 N N St
- 1606 N N St
- 1610 N N St
- 1603 N N St
- 1602 Hodges St
- 2200 W Golf Course Rd
- 2202 W Golf Course Rd
- 1611 Hodges St
- 1602 N N St
- 2100 Community Ln Unit 1063
- 2100 Community Ln
- 2100 Community Ln Unit 1126
- 2100 Community Ln Unit 1129
- 2100 Community Ln Unit 1130
- 2100 Community Ln Unit 1140