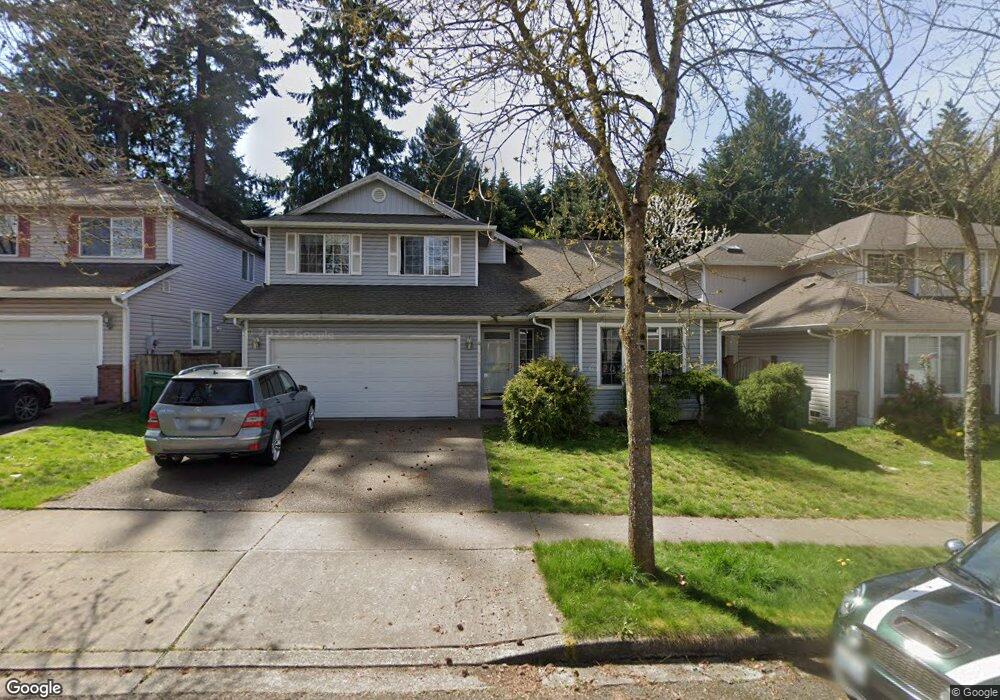
1608 180th St SW Lynnwood, WA 98037
Estimated Value: $925,000 - $996,000
3
Beds
3
Baths
2,164
Sq Ft
$439/Sq Ft
Est. Value
About This Home
This home is located at 1608 180th St SW, Lynnwood, WA 98037 and is currently estimated at $949,697, approximately $438 per square foot. 1608 180th St SW is a home located in Snohomish County with nearby schools including Hazelwood Elementary School, Alderwood Middle School, and Lynnwood High School.
Ownership History
Date
Name
Owned For
Owner Type
Purchase Details
Closed on
Nov 14, 2019
Sold by
Spj Investments Llc
Bought by
Vadnais Richard L and Kassaye Sinkinesh C
Current Estimated Value
Home Financials for this Owner
Home Financials are based on the most recent Mortgage that was taken out on this home.
Original Mortgage
$436,000
Outstanding Balance
$383,568
Interest Rate
3.6%
Estimated Equity
$566,129
Purchase Details
Closed on
Aug 31, 2011
Sold by
Jooo Stephen M and Joo Patricia T
Bought by
Spj Investments Llc
Purchase Details
Closed on
Jun 28, 2010
Sold by
Wongso Albert
Bought by
Joo Stephan M and Joo Patricia T
Purchase Details
Closed on
Oct 16, 2002
Sold by
Rasband Homes Inc
Bought by
Wongso Albert
Home Financials for this Owner
Home Financials are based on the most recent Mortgage that was taken out on this home.
Original Mortgage
$177,000
Interest Rate
6.05%
Create a Home Valuation Report for This Property
The Home Valuation Report is an in-depth analysis detailing your home's value as well as a comparison with similar homes in the area
Home Values in the Area
Average Home Value in this Area
Purchase History
| Date | Buyer | Sale Price | Title Company |
|---|---|---|---|
| Vadnais Richard L | $545,000 | Stewart Title | |
| Spj Investments Llc | -- | Accommodation | |
| Joo Stephan M | $327,500 | First American Title Ins Co | |
| Wongso Albert | $274,950 | -- |
Source: Public Records
Mortgage History
| Date | Status | Borrower | Loan Amount |
|---|---|---|---|
| Open | Vadnais Richard L | $436,000 | |
| Previous Owner | Wongso Albert | $177,000 |
Source: Public Records
Tax History Compared to Growth
Tax History
| Year | Tax Paid | Tax Assessment Tax Assessment Total Assessment is a certain percentage of the fair market value that is determined by local assessors to be the total taxable value of land and additions on the property. | Land | Improvement |
|---|---|---|---|---|
| 2025 | $6,569 | $823,500 | $515,000 | $308,500 |
| 2024 | $6,569 | $792,800 | $495,000 | $297,800 |
| 2023 | $7,265 | $919,000 | $580,000 | $339,000 |
| 2022 | $6,277 | $644,700 | $357,000 | $287,700 |
| 2020 | $5,861 | $531,300 | $284,000 | $247,300 |
| 2019 | $5,302 | $477,800 | $233,000 | $244,800 |
| 2018 | $5,362 | $425,900 | $205,000 | $220,900 |
| 2017 | $4,487 | $368,300 | $162,000 | $206,300 |
| 2016 | $4,162 | $342,600 | $145,000 | $197,600 |
| 2015 | $4,069 | $318,200 | $128,000 | $190,200 |
| 2013 | $3,400 | $251,600 | $102,000 | $149,600 |
Source: Public Records
Map
Nearby Homes
- 14128 15th Ave W
- 14130 15th Ave W
- 14127 15th Ave W
- 17928 15th Ave W
- 17819 19th Ave W
- 18326 16th Place W
- 1622 175th St SW
- 17624 12th Place W
- 18330 Larch Way
- 2204 176th Place SW Unit 3
- 18619 Butternut Rd
- 17828 Larch Way
- 908 185th St SW
- 1110 187th Place SW
- 929 187th Place SW
- 17009 17th Ave W
- 17217 Larch Way
- 1700 Magnolia Rd
- 18901 12th Place W Unit H2
- 17521 7th Ave W
- 1608 180th St SW
- 1608 180th St SW
- 1612 180th St SW
- 1612 180th St SW
- 1606 180th St SW
- 1606 180th St SW
- 1606 180th St SW
- 1617 180th (Lot 17) St SW
- 1616 180th St SW
- 1602 180th St SW
- 1602 180th St SW
- 1602 180th St SW
- 1609 180th St SW
- 17924 16th Ave W
- 1609 180th St SW
- 17924 16th Ave W
- 1620 180th St SW
- 1613 180th St SW
- 1613 180th St SW
- 1613 180th St SW