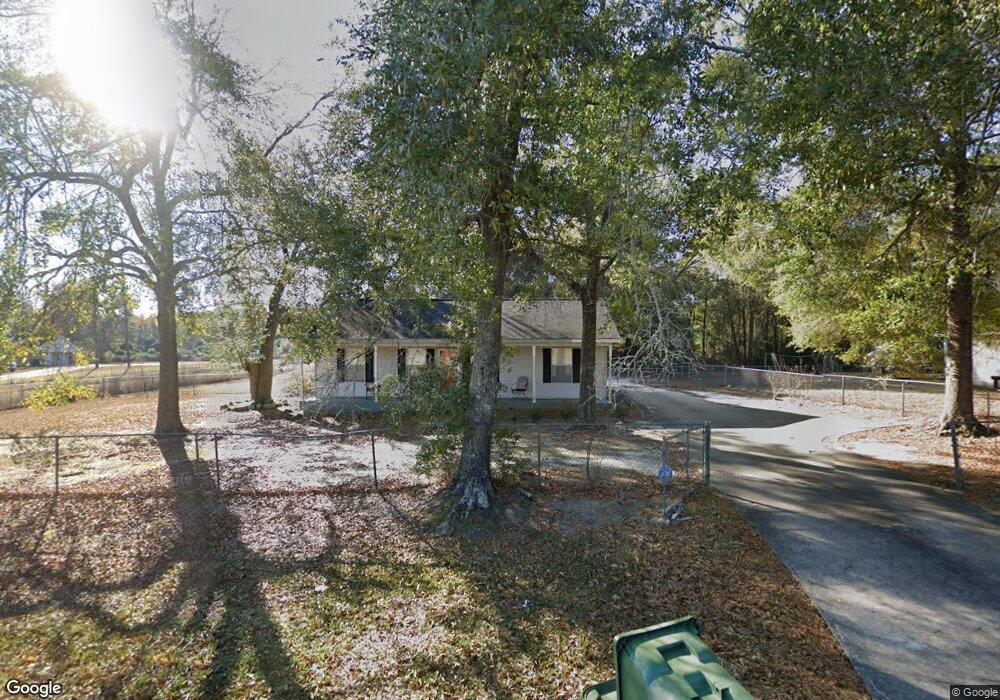
1608 Belcher Ln Bainbridge, GA 39817
Estimated Value: $149,000 - $186,000
--
Bed
1
Bath
1,118
Sq Ft
$149/Sq Ft
Est. Value
About This Home
This home is located at 1608 Belcher Ln, Bainbridge, GA 39817 and is currently estimated at $166,079, approximately $148 per square foot. 1608 Belcher Ln is a home located in Decatur County with nearby schools including Bainbridge High School, Spring Creek Charter Academy, and Grace Christian Academy.
Ownership History
Date
Name
Owned For
Owner Type
Purchase Details
Closed on
Aug 11, 2020
Sold by
Baulkmon Kareem
Bought by
Baulkmon Amber
Current Estimated Value
Purchase Details
Closed on
Mar 22, 2007
Sold by
Baulkmon Amber U
Bought by
Baulkmon Amber U and Baulkmon Kareem
Purchase Details
Closed on
Oct 19, 2005
Sold by
Sec Of Housing & U
Bought by
Salter Amber
Home Financials for this Owner
Home Financials are based on the most recent Mortgage that was taken out on this home.
Original Mortgage
$63,000
Interest Rate
5.76%
Mortgage Type
New Conventional
Purchase Details
Closed on
Dec 7, 2004
Sold by
Countrywide Home Loans Ser
Bought by
Sec Of Housing & Urban
Create a Home Valuation Report for This Property
The Home Valuation Report is an in-depth analysis detailing your home's value as well as a comparison with similar homes in the area
Home Values in the Area
Average Home Value in this Area
Purchase History
| Date | Buyer | Sale Price | Title Company |
|---|---|---|---|
| Baulkmon Amber | -- | -- | |
| Baulkmon Amber U | -- | -- | |
| Salter Amber | -- | -- | |
| Sec Of Housing & Urban | $62,518 | -- |
Source: Public Records
Mortgage History
| Date | Status | Borrower | Loan Amount |
|---|---|---|---|
| Previous Owner | Salter Amber | $63,000 |
Source: Public Records
Tax History Compared to Growth
Tax History
| Year | Tax Paid | Tax Assessment Tax Assessment Total Assessment is a certain percentage of the fair market value that is determined by local assessors to be the total taxable value of land and additions on the property. | Land | Improvement |
|---|---|---|---|---|
| 2024 | $1,400 | $46,056 | $3,400 | $42,656 |
| 2023 | $909 | $46,056 | $3,400 | $42,656 |
| 2022 | $1,365 | $46,024 | $3,400 | $42,624 |
| 2021 | $1,292 | $42,565 | $3,400 | $39,165 |
| 2020 | $1,164 | $36,546 | $3,400 | $33,146 |
| 2019 | $1,142 | $34,645 | $3,400 | $31,245 |
| 2018 | $1,015 | $31,305 | $3,400 | $27,905 |
| 2017 | $1,095 | $31,305 | $3,400 | $27,905 |
| 2016 | $1,035 | $31,305 | $3,400 | $27,905 |
| 2015 | $1,065 | $31,305 | $3,400 | $27,905 |
| 2014 | $988 | $31,305 | $3,400 | $27,905 |
| 2013 | -- | $31,304 | $3,400 | $27,904 |
Source: Public Records
Map
Nearby Homes
- 1602 Belcher Ln
- 1503 Smart St
- 1001 Bluffton Dr
- 1103 Bluffton Dr
- 1606 Hemlock St
- 1302 Majestic Ave
- Lot 7 Easy Dr
- 1000 E Gate Dr
- 000 E River Rd
- 1505 E Water St
- 2032 Lexington Ave
- 2036 Lexington Ave
- 927 5th Ave
- 1204 E Water St
- 705 N Lamar St
- 1020 E Water St
- 206 Plum Nelly Cir
- 401 S Sims St
- 703 S Boulevard Dr
- 515 S Spruce St
- 1606 Belcher Ln
- 1704 Belcher Ln
- 1604 Belcher Ln
- 1800 Belcher Ln
- 1801 Belcher Ln
- 1710 Belcher Ln
- 1609 Belcher Ln
- 1803 Belcher Ln
- 1605 Belcher Ln
- 1706 Belcher Ln
- 1802 Belcher Ln
- 1601 Belcher Ln
- 1600 Belcher Ln
- 1702 Belcher Ln
- 1610 Lincoln St
- 1201 Mckinley St
- 1700 Lincoln St
- 1601 Smart St
- 1608 Lincoln St
- 1515 Belcher Ln