Estimated Value: $69,000 - $188,000
--
Bed
--
Bath
1,208
Sq Ft
$106/Sq Ft
Est. Value
About This Home
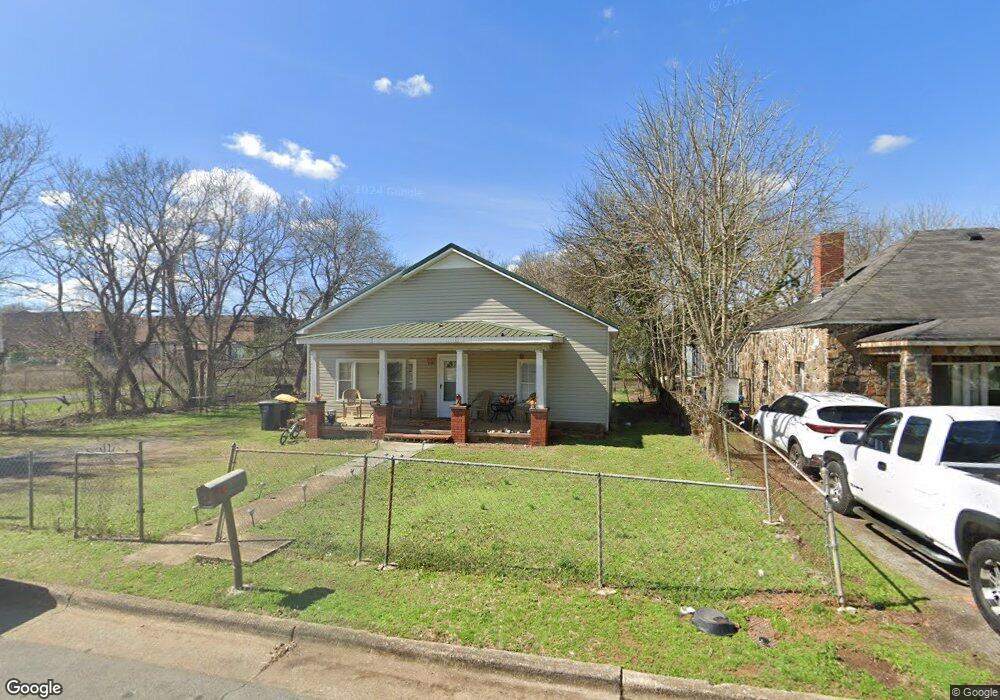
This home is located at 1608 Crane St SW, Rome, GA 30161 and is currently estimated at $128,228, approximately $106 per square foot. 1608 Crane St SW is a home located in Floyd County with nearby schools including Dan McCarty Middle School, Rome High School, and Darlington School.
Ownership History
Date
Name
Owned For
Owner Type
Purchase Details
Closed on
May 19, 2021
Sold by
Gresham Carolyn Ann
Bought by
Gresham Christopher
Current Estimated Value
Purchase Details
Closed on
Dec 14, 2020
Sold by
Plemmons Ronnie
Bought by
Gresham Carol
Purchase Details
Closed on
Feb 17, 1975
Sold by
Gresham Carolyn Gresham Carolyn Gresha
Bought by
Sutherland Charles Sutherland Charl
Purchase Details
Closed on
Oct 23, 1972
Sold by
Wheeler John E Wheeler John E Wheeler
Bought by
Gresham Carolyn Gresham Carolyn Gre
Purchase Details
Closed on
Feb 8, 1972
Sold by
Wheeler John Ernest and Wheeler Margaret E
Bought by
Wheeler John E Wheeler John E Wheel
Purchase Details
Closed on
Sep 23, 1964
Sold by
Sutherland Doyle L Sutherland Doyle L Su
Bought by
Wheeler John Ernest and Wheeler Margaret E
Purchase Details
Closed on
Jan 1, 1901
Bought by
Sutherland Doyle L Sutherland Doyle
Create a Home Valuation Report for This Property
The Home Valuation Report is an in-depth analysis detailing your home's value as well as a comparison with similar homes in the area
Home Values in the Area
Average Home Value in this Area
Purchase History
| Date | Buyer | Sale Price | Title Company |
|---|---|---|---|
| Gresham Christopher | -- | -- | |
| Gresham Carol | -- | -- | |
| Plemmons Ronnie | -- | -- | |
| Crumley Cheryl | -- | -- | |
| Sutherland Charles Sutherland Charl | -- | -- | |
| Gresham Carolyn Gresham Carolyn Gre | $10,000 | -- | |
| Wheeler John E Wheeler John E Wheel | -- | -- | |
| Wheeler John Ernest | -- | -- | |
| Sutherland Doyle L Sutherland Doyle | -- | -- |
Source: Public Records
Tax History Compared to Growth
Tax History
| Year | Tax Paid | Tax Assessment Tax Assessment Total Assessment is a certain percentage of the fair market value that is determined by local assessors to be the total taxable value of land and additions on the property. | Land | Improvement |
|---|---|---|---|---|
| 2024 | $1,313 | $33,743 | $11,440 | $22,303 |
| 2023 | $1,195 | $31,792 | $10,400 | $21,392 |
| 2022 | $951 | $26,050 | $8,320 | $17,730 |
| 2021 | $764 | $24,228 | $8,320 | $15,908 |
| 2020 | $828 | $22,128 | $6,500 | $15,628 |
| 2019 | $781 | $21,112 | $6,500 | $14,612 |
| 2018 | $739 | $19,973 | $6,500 | $13,473 |
| 2017 | $717 | $19,360 | $6,500 | $12,860 |
| 2016 | $703 | $18,920 | $6,480 | $12,440 |
Source: Public Records
Map
Nearby Homes
- 000 E Oglethorpe Hwy
- 39 E 16th St SW
- 1502 Spring Creek St SW
- 304 E 19th St SW
- 106 E 14th St SW
- 1901 Hull Ave SW
- 4 E 15th St SW
- 1705 Olmstead St SW
- 414 E 17th St SW
- 2014 Maple Ave SW
- 14 Clover St SW
- 170 E 11th St SW
- 164 E 11th St SE
- 168 E 11th St SE
- 162 E 11th St SE
- 166 E 11th St SW
- 316 S McLin St SW
- 2 E 10th St SW
- 1606 Crane St SW
- 105 E 17th St SW
- 1604 Crane St SW
- 103 E 17th St SW
- 1602 Crane St SW
- 1607 Crane St SW
- 201 E 17th St SW
- 1605 Crane St SW
- 24 E 16th St SW
- 24 E 16th St SW
- 24 E 16th St SW
- 1603 Crane St SW
- 1701 Crane St SW
- 1600 Crane St SW
- 2 E 16th St SW
- 34 E 16th St SW
- 1703 Crane St SW
- 408 Strand St SW
- 100 E 17th St SW
- 410 Strand St SW