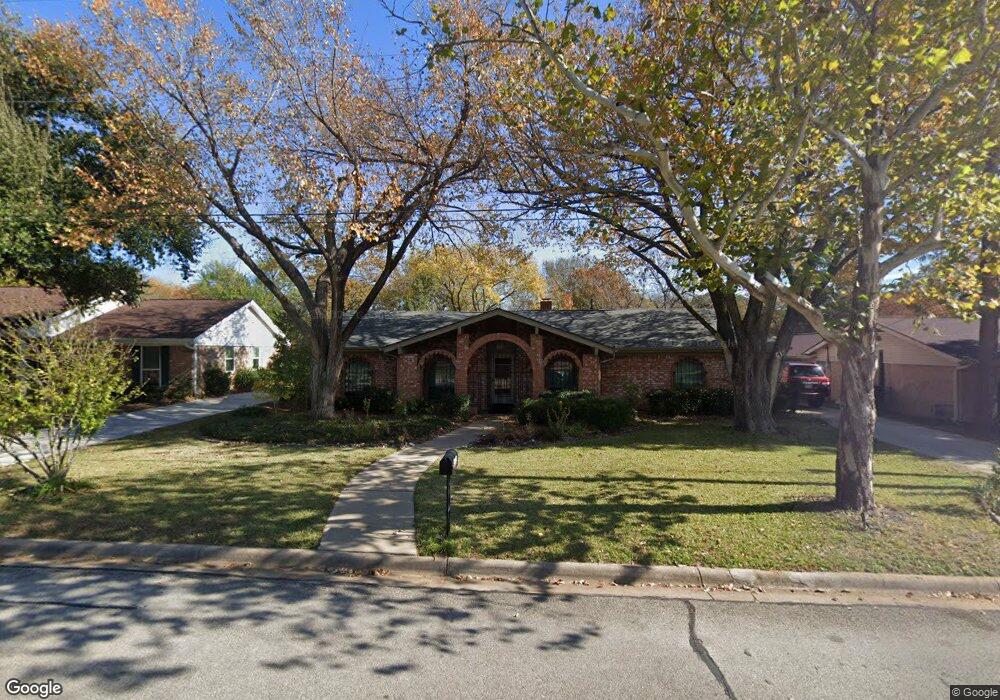
1608 Martha Dr Bedford, TX 76022
Estimated Value: $379,000 - $481,000
4
Beds
3
Baths
2,068
Sq Ft
$200/Sq Ft
Est. Value
About This Home
This home is located at 1608 Martha Dr, Bedford, TX 76022 and is currently estimated at $412,822, approximately $199 per square foot. 1608 Martha Dr is a home located in Tarrant County with nearby schools including Stonegate Elementary School, Central J High School, and L.D. Bell High School.
Ownership History
Date
Name
Owned For
Owner Type
Purchase Details
Closed on
Mar 3, 2023
Sold by
Meehan Terence Joseph
Bought by
Meehan Dana Marisa
Current Estimated Value
Purchase Details
Closed on
Oct 21, 2016
Sold by
Meehan Terence J
Bought by
Meehan Dana
Purchase Details
Closed on
Sep 15, 2000
Sold by
Farhang Linda A and Peterson David Mark
Bought by
Meehan Terence J and Meehan Dana M
Home Financials for this Owner
Home Financials are based on the most recent Mortgage that was taken out on this home.
Original Mortgage
$129,999
Interest Rate
8.01%
Mortgage Type
VA
Purchase Details
Closed on
Feb 9, 2000
Sold by
Farhang Linda A
Bought by
Farhang Linda A and Peterson David Mark
Create a Home Valuation Report for This Property
The Home Valuation Report is an in-depth analysis detailing your home's value as well as a comparison with similar homes in the area
Home Values in the Area
Average Home Value in this Area
Purchase History
| Date | Buyer | Sale Price | Title Company |
|---|---|---|---|
| Meehan Dana Marisa | -- | -- | |
| Meehan Dana | -- | None Available | |
| Meehan Terence J | -- | Alamo Title Company | |
| Farhang Linda A | -- | -- |
Source: Public Records
Mortgage History
| Date | Status | Borrower | Loan Amount |
|---|---|---|---|
| Previous Owner | Meehan Terence J | $129,999 |
Source: Public Records
Tax History Compared to Growth
Tax History
| Year | Tax Paid | Tax Assessment Tax Assessment Total Assessment is a certain percentage of the fair market value that is determined by local assessors to be the total taxable value of land and additions on the property. | Land | Improvement |
|---|---|---|---|---|
| 2025 | $3,466 | $189,366 | $75,000 | $114,366 |
| 2024 | $3,466 | $239,704 | $75,000 | $164,704 |
| 2023 | $4,874 | $268,086 | $55,000 | $213,086 |
| 2022 | $5,045 | $239,686 | $55,000 | $184,686 |
| 2021 | $4,947 | $210,000 | $55,000 | $155,000 |
| 2020 | $4,993 | $210,000 | $55,000 | $155,000 |
| 2019 | $5,102 | $210,000 | $55,000 | $155,000 |
| 2018 | $5,096 | $225,500 | $35,000 | $190,500 |
| 2017 | $5,234 | $216,342 | $35,000 | $181,342 |
| 2016 | $4,459 | $184,322 | $35,000 | $149,322 |
| 2015 | $3,622 | $183,690 | $35,000 | $148,690 |
| 2014 | $3,622 | $155,200 | $20,000 | $135,200 |
Source: Public Records
Map
Nearby Homes