Estimated Value: $765,647 - $985,000
3
Beds
3
Baths
2,956
Sq Ft
$290/Sq Ft
Est. Value
About This Home
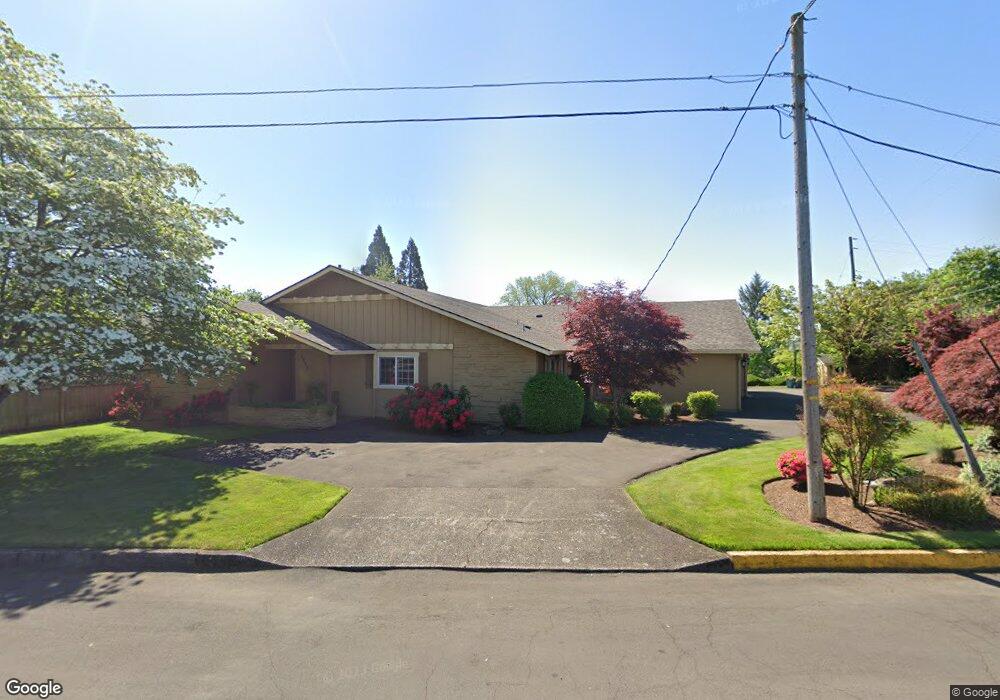
This home is located at 1608 NE Ione Loop, Camas, WA 98607 and is currently estimated at $857,412, approximately $290 per square foot. 1608 NE Ione Loop is a home located in Clark County with nearby schools including Helen Baller Elementary School, Liberty Middle School, and Camas High School.
Ownership History
Date
Name
Owned For
Owner Type
Purchase Details
Closed on
Jun 22, 2010
Sold by
Marlow Gene R and Marlow Kristine A
Bought by
Stoller Steven D and Stoller Linda M
Current Estimated Value
Home Financials for this Owner
Home Financials are based on the most recent Mortgage that was taken out on this home.
Original Mortgage
$412,834
Interest Rate
4.52%
Mortgage Type
FHA
Purchase Details
Closed on
Mar 12, 1999
Sold by
Hatch Thomas Lynn and Hatch Whitney Gail Podpechan
Bought by
Marlow Gene R and Marlow Kristine A
Home Financials for this Owner
Home Financials are based on the most recent Mortgage that was taken out on this home.
Original Mortgage
$140,000
Interest Rate
6.73%
Purchase Details
Closed on
Jul 21, 1997
Sold by
Schlegel David J and Schlegel Linda D
Bought by
Hatch Thomas Lynn and Hatch Whitney Gail Podpechan
Home Financials for this Owner
Home Financials are based on the most recent Mortgage that was taken out on this home.
Original Mortgage
$176,250
Interest Rate
7.62%
Create a Home Valuation Report for This Property
The Home Valuation Report is an in-depth analysis detailing your home's value as well as a comparison with similar homes in the area
Home Values in the Area
Average Home Value in this Area
Purchase History
| Date | Buyer | Sale Price | Title Company |
|---|---|---|---|
| Stoller Steven D | $425,000 | Chicago Title | |
| Marlow Gene R | $205,000 | First American Title Ins Co | |
| Hatch Thomas Lynn | $235,000 | First American Title Ins Co |
Source: Public Records
Mortgage History
| Date | Status | Borrower | Loan Amount |
|---|---|---|---|
| Previous Owner | Stoller Steven D | $412,834 | |
| Previous Owner | Marlow Gene R | $140,000 | |
| Previous Owner | Hatch Thomas Lynn | $176,250 |
Source: Public Records
Tax History Compared to Growth
Tax History
| Year | Tax Paid | Tax Assessment Tax Assessment Total Assessment is a certain percentage of the fair market value that is determined by local assessors to be the total taxable value of land and additions on the property. | Land | Improvement |
|---|---|---|---|---|
| 2025 | $6,530 | $638,295 | $154,425 | $483,870 |
| 2024 | $6,162 | $685,018 | $206,726 | $478,292 |
| 2023 | $6,016 | $695,014 | $194,560 | $500,454 |
| 2022 | $6,757 | $671,944 | $187,416 | $484,528 |
| 2021 | $6,519 | $605,946 | $167,899 | $438,047 |
| 2020 | $6,799 | $541,787 | $147,191 | $394,596 |
| 2019 | $6,285 | $523,966 | $139,425 | $384,541 |
| 2018 | $7,457 | $515,909 | $0 | $0 |
| 2017 | $6,609 | $639,233 | $0 | $0 |
| 2016 | $6,133 | $496,683 | $0 | $0 |
| 2015 | $6,026 | $458,554 | $0 | $0 |
| 2014 | -- | $424,820 | $0 | $0 |
| 2013 | -- | $390,484 | $0 | $0 |
Source: Public Records
Map
Nearby Homes
- 632 NE Everett St
- 924 NE 3rd Ave
- 136 NE Garfield St
- 719 NE Dallas St Unit A4
- 1303 Division St
- 1623 Division St
- 124 NW 18th Ave
- 441 NW 15th Ave
- 520 NE Province Dr
- 750 NE Province Ct
- 522 NE Province Dr
- 536 NW 10th Ave
- 535 NW 9th Ave
- 2193 NE 3rd Ave
- 2052 NW Fargo Loop
- 761 SE Polk St
- 541 NW 8th Ave
- 2120 NW Fargo Loop
- 659 SE Russell St
- 615 NW 7th Ave
- 1620 NE Ione Loop
- 1617 NE Ione Loop
- 1636 NE Ione Loop
- 1718 NE Ione St
- 1645 NE Ione Loop
- 1041 NE 6th Ave
- 1025 NE 6th Ave
- 1642 NE Ione Loop
- 1105 NE 6th Ave
- 1834 NE Ione Loop
- 1015 NE 6th Ave
- 1817 NE Ione Loop
- 1005 NE 6th Ave
- 1119 NE 6th Ave
- 935 NE 6th Ave
- 1702 NE Ione Loop
- 923 NE 6th Ave
- 1718 NE Ione Loop
- 1016 NE 6th Ave
- 1034 NE 6th Ave