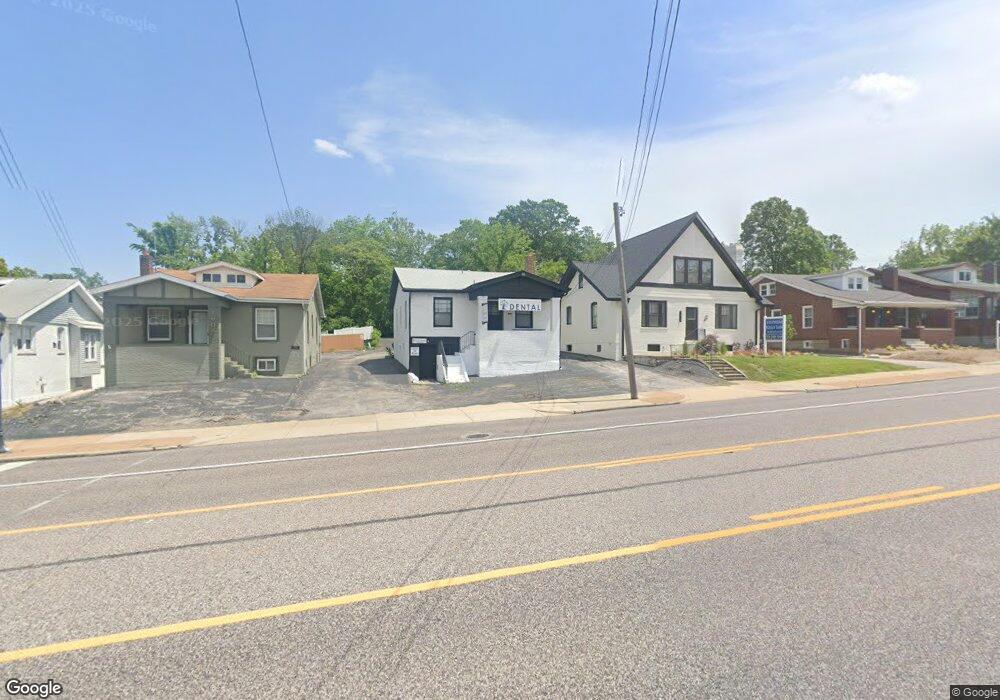
1608 S Big Bend Blvd Saint Louis, MO 63117
Estimated Value: $375,000
--
Bed
--
Bath
2,283
Sq Ft
$164/Sq Ft
Est. Value
About This Home
This home is located at 1608 S Big Bend Blvd, Saint Louis, MO 63117 and is currently priced at $375,000, approximately $164 per square foot. 1608 S Big Bend Blvd is a home located in St. Louis County with nearby schools including Maplewood Richmond Heights Elementary School, Maplewood Richmond Heights Middle School, and Maplewood-Richmond Heights High School.
Ownership History
Date
Name
Owned For
Owner Type
Purchase Details
Closed on
Mar 21, 2022
Sold by
Shortell James G
Bought by
Pb & J Dental Holdings Llc
Current Estimated Value
Home Financials for this Owner
Home Financials are based on the most recent Mortgage that was taken out on this home.
Original Mortgage
$250,000
Outstanding Balance
$233,581
Interest Rate
3.92%
Mortgage Type
New Conventional
Purchase Details
Closed on
Dec 4, 2004
Sold by
Shortell Elizabeth
Bought by
Shortell James G
Purchase Details
Closed on
Jul 14, 2000
Sold by
Eatherly Betty and Eatherly Ross
Bought by
Shortell James G and Shortell Elizabeth
Home Financials for this Owner
Home Financials are based on the most recent Mortgage that was taken out on this home.
Original Mortgage
$114,750
Interest Rate
8.23%
Create a Home Valuation Report for This Property
The Home Valuation Report is an in-depth analysis detailing your home's value as well as a comparison with similar homes in the area
Home Values in the Area
Average Home Value in this Area
Purchase History
| Date | Buyer | Sale Price | Title Company |
|---|---|---|---|
| Pb & J Dental Holdings Llc | -- | Title Partners | |
| Shortell James G | -- | -- | |
| Shortell James G | $135,000 | -- |
Source: Public Records
Mortgage History
| Date | Status | Borrower | Loan Amount |
|---|---|---|---|
| Open | Pb & J Dental Holdings Llc | $250,000 | |
| Previous Owner | Shortell James G | $114,750 |
Source: Public Records
Tax History Compared to Growth
Tax History
| Year | Tax Paid | Tax Assessment Tax Assessment Total Assessment is a certain percentage of the fair market value that is determined by local assessors to be the total taxable value of land and additions on the property. | Land | Improvement |
|---|---|---|---|---|
| 2025 | $6,514 | $64,900 | $15,620 | $49,280 |
| 2024 | $6,514 | $64,480 | $15,620 | $48,860 |
| 2023 | $6,525 | $64,480 | $15,620 | $48,860 |
| 2022 | $6,266 | $57,160 | $15,620 | $41,540 |
| 2021 | $6,218 | $57,160 | $15,620 | $41,540 |
| 2020 | $5,843 | $53,120 | $13,660 | $39,460 |
| 2019 | $5,787 | $53,120 | $13,660 | $39,460 |
| 2018 | $5,372 | $48,090 | $13,660 | $34,430 |
| 2017 | $5,352 | $48,090 | $13,660 | $34,430 |
| 2016 | $7,057 | $64,860 | $30,430 | $34,430 |
| 2015 | $6,670 | $64,860 | $30,430 | $34,430 |
| 2014 | $7,043 | $65,990 | $26,980 | $39,010 |
Source: Public Records
Map
Nearby Homes
- 1723 Mccready Ave
- 7572 Hiawatha Ave
- 1425 Silverton Place
- 7590 W Bruno Ave
- 7400 Williams Ave
- 7615 W Bruno Ave
- 7569 Dale Ave
- 7555 Alicia Ave
- 1323 Woodland Dr
- 1319 Woodland Dr
- 2011 Alameda Ave
- 7342 Dale Ave
- 1338 Sunset Ave
- 7765 Weston Place
- 2024 Bellevue Ave
- 7718 W Ranken Ave
- 7715 Dale Ave
- 7723 Dale Ave
- 1717 Yale Ave
- 1623 Yale Ave
- 1606 S Big Bend Blvd
- 1610 S Big Bend Blvd
- 1602 S Big Bend Blvd
- 1612 S Big Bend Blvd
- 7472 Arlington Dr
- 1600 S Big Bend Blvd
- 7468 Arlington Dr
- 7481 Hiawatha Ave
- 7481 Hiawatha Tbb
- 7481TBB Hiawatha
- 7479 Hiawatha Ave
- 7464 Arlington Dr
- 7460 Arlington Dr
- 7475 Hiawatha Ave
- 7456 Arlington Dr
- 1528 S Big Bend Blvd
- 7469 Hiawatha Ave
- 1711 Boneta Ave
- 7511 Hiawatha Ave
- 7455 Arlington Dr