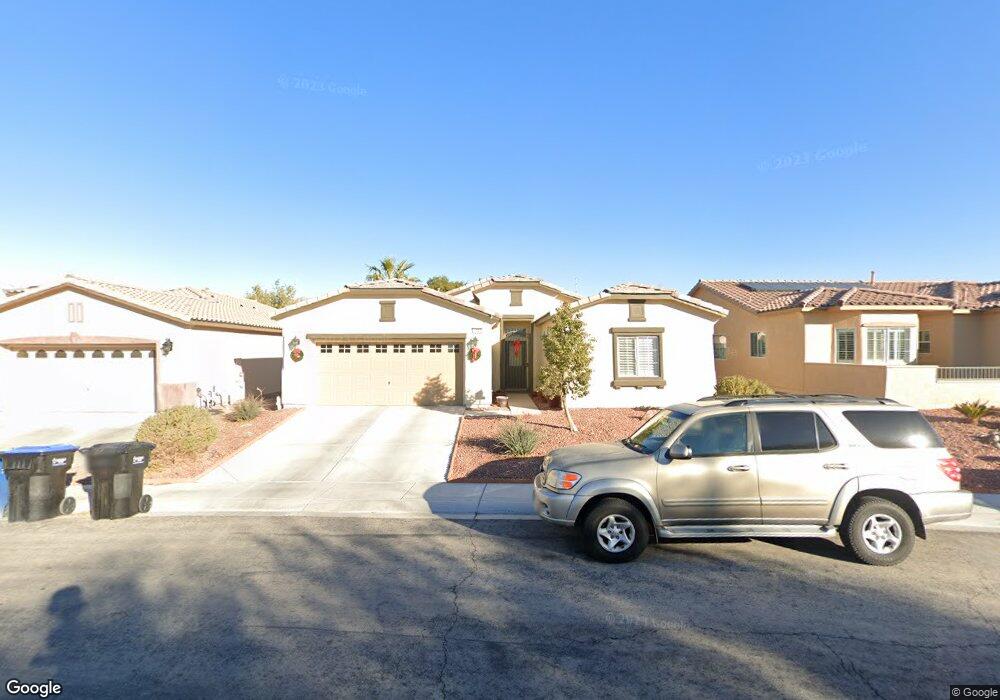
1608 Sagebrush Ranch Way Unit 3 North Las Vegas, NV 89081
Northridge NeighborhoodEstimated Value: $422,000 - $461,000
4
Beds
2
Baths
1,926
Sq Ft
$232/Sq Ft
Est. Value
About This Home
This home is located at 1608 Sagebrush Ranch Way Unit 3, North Las Vegas, NV 89081 and is currently estimated at $445,896, approximately $231 per square foot. 1608 Sagebrush Ranch Way Unit 3 is a home located in Clark County with nearby schools including Don E. Hayden Elementary School, Ruby Duncan Elementary School, and Carroll M. Johnston STEM Academy of Environmental Studies.
Ownership History
Date
Name
Owned For
Owner Type
Purchase Details
Closed on
Dec 6, 2018
Sold by
Mickens Marjorie J
Bought by
Mickens Marjorie J and The Marjorie J Mickens Revocable Living
Current Estimated Value
Purchase Details
Closed on
Dec 23, 2003
Sold by
William Lyon Homes Inc
Bought by
Mickens Marjorie J
Home Financials for this Owner
Home Financials are based on the most recent Mortgage that was taken out on this home.
Original Mortgage
$192,800
Outstanding Balance
$90,275
Interest Rate
6.03%
Mortgage Type
Unknown
Estimated Equity
$355,621
Create a Home Valuation Report for This Property
The Home Valuation Report is an in-depth analysis detailing your home's value as well as a comparison with similar homes in the area
Home Values in the Area
Average Home Value in this Area
Purchase History
| Date | Buyer | Sale Price | Title Company |
|---|---|---|---|
| Mickens Marjorie J | -- | None Available | |
| Mickens Marjorie J | $197,935 | Fidelity National Title |
Source: Public Records
Mortgage History
| Date | Status | Borrower | Loan Amount |
|---|---|---|---|
| Open | Mickens Marjorie J | $192,800 | |
| Closed | Mickens Marjorie J | $36,150 |
Source: Public Records
Tax History Compared to Growth
Tax History
| Year | Tax Paid | Tax Assessment Tax Assessment Total Assessment is a certain percentage of the fair market value that is determined by local assessors to be the total taxable value of land and additions on the property. | Land | Improvement |
|---|---|---|---|---|
| 2025 | $2,075 | $140,219 | $35,700 | $104,519 |
| 2024 | $2,015 | $140,219 | $35,700 | $104,519 |
| 2023 | $2,015 | $129,936 | $31,850 | $98,086 |
| 2022 | $1,956 | $118,485 | $28,350 | $90,135 |
| 2021 | $1,899 | $109,926 | $24,500 | $85,426 |
| 2020 | $1,841 | $102,588 | $25,550 | $77,038 |
| 2019 | $1,819 | $96,861 | $22,050 | $74,811 |
| 2018 | $1,735 | $86,446 | $17,500 | $68,946 |
| 2017 | $2,609 | $77,776 | $16,800 | $60,976 |
| 2016 | $1,625 | $67,653 | $13,650 | $54,003 |
| 2015 | $1,621 | $56,742 | $9,450 | $47,292 |
| 2014 | $1,574 | $45,523 | $7,350 | $38,173 |
Source: Public Records
Map
Nearby Homes
- 1409 Palomino Farm Way
- 6216 Sterling Ranch Way
- 1505 Dragonfly Ranch Ln
- 6242 Standing Elm St
- 1504 Andrew David Ave
- 6424 Amanda Michelle Ln
- 1023 Sunny Acres Ave
- 1008 Maple Pines Ave
- 6016 Star Point Ct
- 5925 Teeter St
- 2330 Tate Ave
- 2326 Tate Ave
- 6504 N Austin Moore St
- 2014 Millergrove Ave
- 2255 Woodbluff Ave
- 6005 Golden Sun Ct
- 6020 Old Vines St
- 1213 Bistro Bay Ave Unit 3
- 909 Nevada Blaze Ave
- 1020 Oceanwood Ave
- 1604 Sagebrush Ranch Way
- 1612 Sagebrush Ranch Way
- 1512 Sagebrush Ranch Way
- 1704 Sagebrush Ranch Way
- 1609 Palomino Farm Way Unit 3
- 1613 Palomino Farm Way Unit 3
- 1605 Palomino Farm Way
- 1705 Palomino Farm Way Unit 3
- 1513 Palomino Farm Way
- 1609 Sagebrush Ranch Way
- 1508 Sagebrush Ranch Way Unit 3
- 1708 Sagebrush Ranch Way Unit 3
- 1613 Sagebrush Ranch Way
- 1605 Sagebrush Ranch Way
- 1709 Palomino Farm Way
- 1509 Palomino Farm Way
- 1705 Sagebrush Ranch Way
- 1504 Sagebrush Ranch Way Unit 3
- 1712 Sagebrush Ranch Way
- 1513 Sagebrush Ranch Way