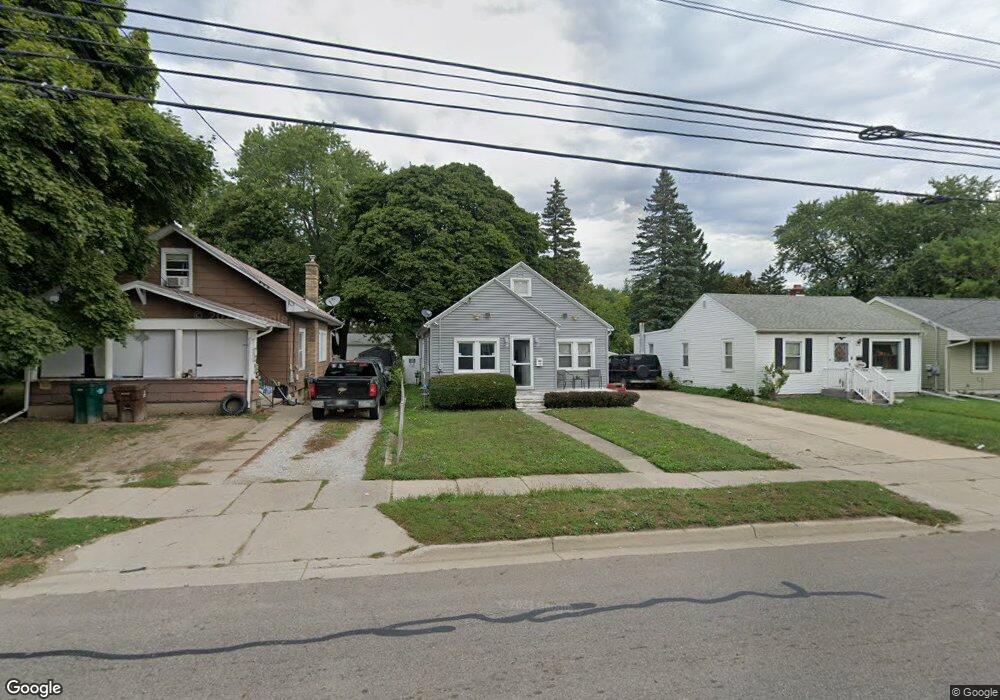
1608 W Willow St Lansing, MI 48915
Bassett Park NeighborhoodEstimated Value: $101,000 - $127,000
3
Beds
1
Bath
1,073
Sq Ft
$104/Sq Ft
Est. Value
About This Home
This home is located at 1608 W Willow St, Lansing, MI 48915 and is currently estimated at $111,437, approximately $103 per square foot. 1608 W Willow St is a home located in Ingham County with nearby schools including Willow School, Pattengill Academy, and J.W. Sexton High School.
Ownership History
Date
Name
Owned For
Owner Type
Purchase Details
Closed on
Jun 11, 2025
Sold by
Chapin Carl Duane
Bought by
Chapin Carl Duane and Smith Kiesha Lynn
Current Estimated Value
Purchase Details
Closed on
Sep 26, 2012
Sold by
Gray Thomas and Gray Tonda
Bought by
Chapin Carl Duane
Purchase Details
Closed on
Sep 28, 2006
Sold by
Altemeier Thomas
Bought by
Wells Fargo Bank Na and Asset Backed Pass Through Certificates S
Purchase Details
Closed on
Feb 1, 2005
Sold by
Bowers Robert H and Hicks Dorothy Ann
Bought by
Altemeier Thomas
Home Financials for this Owner
Home Financials are based on the most recent Mortgage that was taken out on this home.
Original Mortgage
$76,500
Interest Rate
8.8%
Mortgage Type
Fannie Mae Freddie Mac
Purchase Details
Closed on
Oct 14, 2004
Sold by
Bowers Robert H and Bowers Minnie L
Bought by
S & S Acquisitions
Purchase Details
Closed on
Feb 13, 1996
Sold by
Burnham Jeffery and Roxanne D
Bought by
Bowers Robert H and Bowers Minnie
Create a Home Valuation Report for This Property
The Home Valuation Report is an in-depth analysis detailing your home's value as well as a comparison with similar homes in the area
Home Values in the Area
Average Home Value in this Area
Purchase History
| Date | Buyer | Sale Price | Title Company |
|---|---|---|---|
| Chapin Carl Duane | -- | None Listed On Document | |
| Chapin Carl Duane | $34,000 | None Available | |
| Wells Fargo Bank Na | $84,477 | None Available | |
| Altemeier Thomas | $85,000 | Bell Title Company | |
| S & S Acquisitions | $26,401 | -- | |
| Bowers Robert H | $26,900 | -- |
Source: Public Records
Mortgage History
| Date | Status | Borrower | Loan Amount |
|---|---|---|---|
| Previous Owner | Altemeier Thomas | $76,500 |
Source: Public Records
Tax History Compared to Growth
Tax History
| Year | Tax Paid | Tax Assessment Tax Assessment Total Assessment is a certain percentage of the fair market value that is determined by local assessors to be the total taxable value of land and additions on the property. | Land | Improvement |
|---|---|---|---|---|
| 2025 | $1,770 | $46,100 | $3,800 | $42,300 |
| 2024 | $14 | $41,500 | $3,800 | $37,700 |
| 2023 | $367 | $35,900 | $3,800 | $32,100 |
| 2022 | $352 | $27,900 | $3,900 | $24,000 |
| 2021 | $1,471 | $26,600 | $4,900 | $21,700 |
| 2020 | $1,462 | $25,600 | $4,900 | $20,700 |
| 2019 | $1,399 | $25,000 | $4,900 | $20,100 |
| 2018 | $1,314 | $21,800 | $4,900 | $16,900 |
| 2017 | $1,292 | $21,800 | $4,900 | $16,900 |
| 2016 | $2,206 | $21,400 | $4,900 | $16,500 |
| 2015 | $2,206 | $20,900 | $9,771 | $11,129 |
| 2014 | $2,206 | $21,100 | $12,000 | $9,100 |
Source: Public Records
Map
Nearby Homes
- 1327 N Jenison Ave
- 1320 Glenrose Ave
- 1338 Glenrose Ave
- 1432 Redwood St
- 1422 Redwood St
- 1224 Theodore St
- 1840 W Maple St
- 1310 W Maple St
- 1016 Cleo St
- 1300 W Maple St
- 1620 Comfort St
- 912 Cleo St
- 1129 N Martin Luther King jr Blvd
- 819 N Jenison Ave
- 910 Durant St
- 821 N Verlinden Ave
- 914 Stanley St
- 751 Westmoreland Ave
- 908 Clyde St
- 1616 Roseneath Ave
- 1604 W Willow St
- 1600 W Willow St
- 1310 Comfort St
- 1624 W Willow St
- 1518 W Willow St
- 1318 Comfort St
- 1322 Comfort St
- 1217 Hapeman St
- 1508 W Willow St
- 1609 W Willow St
- 1218 Hapeman St
- 1311 N Jenison Ave
- 1515 W Willow St
- 1319 Comfort St
- 1315 Comfort St
- 1317 N Jenison Ave
- 1328 Comfort St
- 1209 Hapeman St