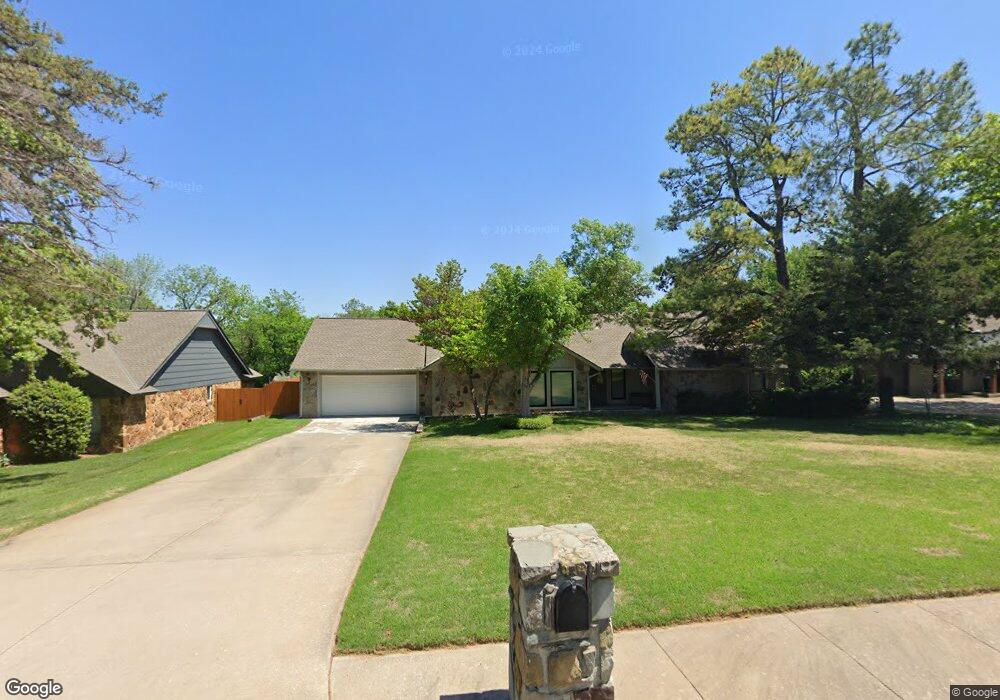
1608 Walnut Cove Rd Edmond, OK 73013
Hafer Park NeighborhoodEstimated Value: $380,953 - $409,000
3
Beds
3
Baths
2,643
Sq Ft
$150/Sq Ft
Est. Value
About This Home
This home is located at 1608 Walnut Cove Rd, Edmond, OK 73013 and is currently estimated at $396,238, approximately $149 per square foot. 1608 Walnut Cove Rd is a home located in Oklahoma County with nearby schools including Will Rogers Elementary School, Central Middle School, and Memorial High School.
Ownership History
Date
Name
Owned For
Owner Type
Purchase Details
Closed on
Nov 20, 2003
Sold by
Cendant Mobility Financial Corp
Bought by
Bergmann Robert and Bergmann Donna
Current Estimated Value
Home Financials for this Owner
Home Financials are based on the most recent Mortgage that was taken out on this home.
Original Mortgage
$205,200
Outstanding Balance
$95,197
Interest Rate
6.01%
Mortgage Type
Purchase Money Mortgage
Estimated Equity
$301,041
Purchase Details
Closed on
Nov 15, 2003
Sold by
Samuelson Francis A and Samuelson Nancy J
Bought by
Cendant Mobility Financial Corp
Home Financials for this Owner
Home Financials are based on the most recent Mortgage that was taken out on this home.
Original Mortgage
$205,200
Outstanding Balance
$95,197
Interest Rate
6.01%
Mortgage Type
Purchase Money Mortgage
Estimated Equity
$301,041
Purchase Details
Closed on
Aug 29, 2003
Sold by
Huckelbury Earnest C and Huckelbury Ellen
Bought by
Samuelson Francis A and Samuelson Nancy J
Create a Home Valuation Report for This Property
The Home Valuation Report is an in-depth analysis detailing your home's value as well as a comparison with similar homes in the area
Home Values in the Area
Average Home Value in this Area
Purchase History
| Date | Buyer | Sale Price | Title Company |
|---|---|---|---|
| Bergmann Robert | $216,000 | Oklahoma Title & Closing Co | |
| Cendant Mobility Financial Corp | $216,000 | Oklahoma Title & Closing Co | |
| Samuelson Francis A | $205,000 | Stewart Abstract & Title Inc |
Source: Public Records
Mortgage History
| Date | Status | Borrower | Loan Amount |
|---|---|---|---|
| Open | Bergmann Robert | $205,200 |
Source: Public Records
Tax History Compared to Growth
Tax History
| Year | Tax Paid | Tax Assessment Tax Assessment Total Assessment is a certain percentage of the fair market value that is determined by local assessors to be the total taxable value of land and additions on the property. | Land | Improvement |
|---|---|---|---|---|
| 2024 | $2,871 | $29,403 | $5,062 | $24,341 |
| 2023 | $2,871 | $28,546 | $5,714 | $22,832 |
| 2022 | $2,795 | $27,715 | $4,351 | $23,364 |
| 2021 | $2,698 | $26,908 | $4,729 | $22,179 |
| 2020 | $2,648 | $26,125 | $5,094 | $21,031 |
| 2019 | $2,666 | $26,172 | $5,071 | $21,101 |
| 2018 | $2,601 | $25,410 | $0 | $0 |
| 2017 | $2,635 | $25,849 | $4,860 | $20,989 |
| 2016 | $2,659 | $26,119 | $4,859 | $21,260 |
| 2015 | $2,575 | $25,359 | $4,860 | $20,499 |
| 2014 | $2,706 | $26,632 | $4,844 | $21,788 |
Source: Public Records
Map
Nearby Homes
- 1600 Turtlecreek Rd
- 1404 Folkstone
- 1601 Hazelhurst
- 2600 Tahoe Dr
- 1921 Chaparral Ln
- 1401 Carrick Ct
- 2417 Rosewood Ln
- 1901 Whipporwill Ct
- 1408 Carlton
- 2416 Chimney Hill Ct
- 2800 E 15th St
- 2208 Dover Dr
- 2209 Dover Dr
- 2917 Cedar Oak Dr
- 1908 Worthington Ln
- 2900 Kingwood Dr
- 900 Woodbury Dr
- 745 Martina Ln
- 732 Tuscany Way
- 1409 Bella Vista Dr
- 1616 Walnut Cove Rd
- 1600 Walnut Cove Rd
- 17721 Walnut Cove Rd
- 17741 Walnut Cove Rd
- 17623 Walnut Cove Rd
- 1516 Walnut Cove Rd
- 1624 Walnut Cove Rd
- 1609 Walnut Cove Rd
- 1617 Walnut Cove Rd
- 1700 Walnut Cove Rd
- 1508 Walnut Cove Rd
- 1601 Walnut Cove Rd
- 1625 Walnut Cove Rd
- 1517 Walnut Cove Rd
- 1509 Walnut Cove Rd
- 1701 Walnut Cove Rd
- 1708 Walnut Cove Rd
- 1500 Walnut Cove Rd
- 1608 Turtlecreek Rd
- 1700 Turtlecreek Rd